Validation of liquid chromatography mass spectrometry (LC-MS) methods
5.1 Bias and its constituents
Different guidance materials use different terms for expressing (Table 1). In this course we use the term trueness with the meaning given in the International Vocabulary of Metrology (VIM) [] – closeness of agreement between the average of an infinite number of replicate measured quantity values and a reference quantity value. The term has a different meaning and will be discussed more thoroughly in section 7.
Table 1. Terms used for trueness in different guidance materials.
|
Organization |
Term |
Meaning according to VIM |
|
Eurachem, , ISO |
Accuracy Trueness |
Accuracy Trueness |
|
ICH, , EMA |
Accuracy |
Trueness |
|
IUPAC, NordVal |
Trueness |
Trueness |
As a rule, trueness of a method is quantitatively expressed as or relative bias. Bias is defined as the estimate of the systematic error. In practice bias is usually determined as the difference between the mean obtained from a large number of replicate measurements with a sample having a reference value. It can be expressed as an absolute bias (Eq. 1 below), i.e. simply the difference, or as a relative bias (Eq 2 below), i.e. as a difference divided by the reference value. The main causes of bias in LC-MS results can be termed as bias constituents and are the following:
1. Bias caused by the analyte loss during sample preparation, expressed quantitatively by (R);
2. Bias due to the limited of the analyte (see in Stability section) in the sample solution (Bstab);
3. Bias due to the ionization suppression/enhancement, i.e. matrix effect (MEionization);
4. Bias due to other possible effects (Bother), e.g. purity of the standard substance, calibration bias of volumetric ware.
Table 2 presents the relations between these terms.
Table 2. Bias and related terms together with the equations for calculating them.
|
Expression |
Calculation (1) |
Comments |
|
Bias |
Absolute bias:
|
Bias takes into account the effects influencing the result that are systematic over a long term, (5) occurring at any stage of the analytical process. Bias can be expressed as an absolute or relative bias.
Absolute bias is useful when it is either constant over the used concentration range or if it is evaluated separately at different concentrations.
Relative bias is useful when the absolute bias is proportional to the analyte concentration and it is desired that the same bias estimate could be used at different concentration levels. |
|
Process efficiency (2), PE |
|
Process efficiency (PE) refers to the joint effect of possible losses during sample preparation and ionization suppression/enhancement in the ion source. PE is a useful parameter for characterizing the analysis method when it is either required for the characterization of the method or when it is intended to carry out correction with PE (more generally: bias correction). |
|
Recovery (2), R |
|
Recovery (7) expresses the efficiency of the sample preparation step: the proportion of an analyte obtained from the sample during sample preparation (see also (4)). |
|
Ionization suppression/enhancement (matrix effect), MEionization (2), (8) |
|
In LC-MS the term matrix effect refers to the suppression (usually) or enhancement (rarely) (9) of analyte ionization in the ion source by co-eluting compounds originating from the sample matrix. manalyte detected – analyte amount detected in the sample manalyte extracted – analyte amount actually extracted from the sample. |
|
Stability, Bstab |
See section 8 for discussion
|
This bias constituent takes into account losses due to the analyte decomposition. Depending at which stage of the sample preparation the decomposition occurs, there are different types of stability (see section 8 below). |
|
Bother |
|
This bias constituent takes into account other bias sources (e.g. calibration of glassware) that are not connected to the above mentioned factors. |
(1) Xlab: average of results obtained by the laboratory; Xref: reference value.
(2) Can be expressed as a simple ratio or as a percentage (in the latter case the ratio is multiplied by 100).
(3) This bias is expressed as a percentage. Absence of bias corresponds to 0%. Negative bias values indicate negative and positive bias values positive bias.
(4) This way of expressing relative bias differs from the one in Eq 2. The absence of bias in this case corresponds to 1. Bias values below 1 indicate a negative bias and values above 1 indicate a positive bias. In many areas the ratio Xlab/Xref is interpreted as recovery, i.e. the four bias components in this equation would combine into recovery. However, in LC-MS it is useful to make a distinction between recovery – relating specifically to sample preparation – and other bias components.
(5) Bias can also be determined as the short-term i.e. within-day bias (see below), but the long-term bias is more useful, e.g. for measurement uncertainty estimation, as is explained in section 7.
(6) This equation holds, if Bstab and Bother are insignificantly different from 1.
(7) In the case of most other analytical techniques recovery would also include the possible matrix effects, so that it would effectively be equal to PE as defined above.
(8) There are different ways of expressing the matrix effect. We use the way which is similar to expressing recovery and process efficiency.
(9) In the case of alleged ionization enhancement it may under closer examination turn out that the reason for the enhanced signal is not the analyte signal enhancement but the interference from some other compound in the matrix, which accidentally gives precursor and product ions with the same m/z value as the analyte [] i.e. apparent ionization enhancement may in fact be caused by insufficient .
Trueness and
http://www.uttv.ee/naita?id=23293
https://www.youtube.com/watch?v=NvmMbrrDjD4
Matrix effect
http://www.uttv.ee/naita?id=23247
https://www.youtube.com/watch?v=nevwRplJNKU
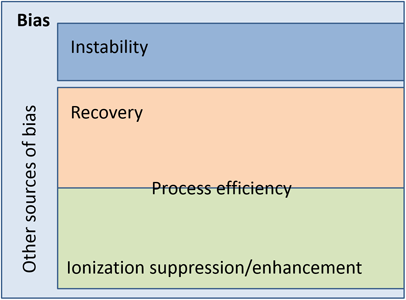
Figure 1 illustrates the interrelations between the different bias components. Process efficiency embraces both sample preparation recovery and possible ionization suppression/enhancement in the ion source. An additional important source of bias is a possible instability of the analyte. The remaining area on the figure stands for all other (usually smaller) bias components, such as, e.g. calibration of glassware. In LC-MS literature, a process efficiency (PE) is often used as a LC-MS specific term for the overall trueness (if Bother and Bstab are insignificant).

Figure 1. Relations between the bias constituents.
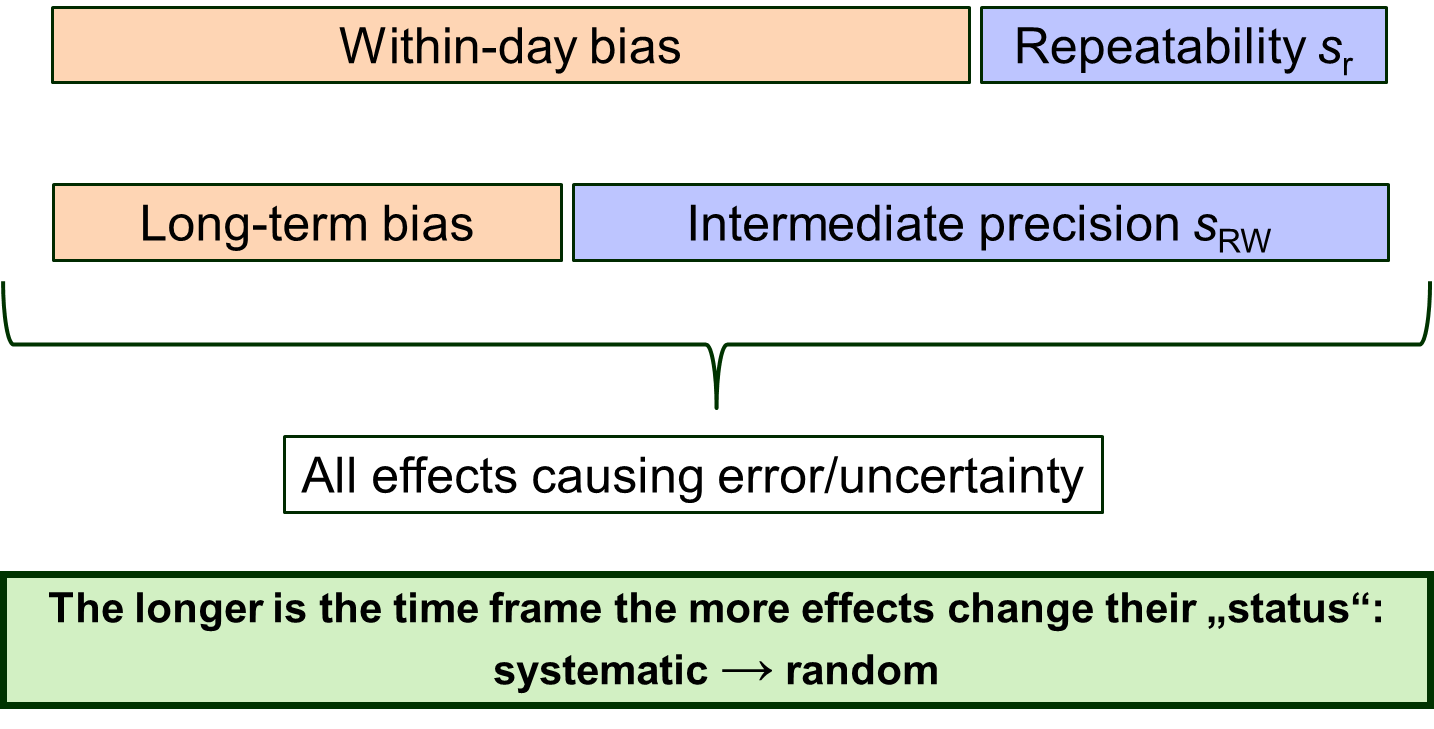
Bias is also dependent on the examined timeframe. In the short term, e.g. within a day, a number of effects cause bias, such as e.g. deviation of the calibration graph of that day from the “true” calibration graph. In the long term, e.g. half a year, if a new calibration graph was made every day, its effect becomes random.
For this reason, the within-day bias is larger than the long-term bias – the longer time we examine, the more effects will switch their status from systematic to random. Consequently, a within-day precision (, sr) is smaller than a long-term precision (within-lab , sRW). Figure 2 explains these relations.
Determining precision is significantly easier and the obtained precision estimates are generally more reliable than bias estimates. Therefore, if possible, it is more useful and informative to work in such a way that as few as possible effects are accounted for in bias and as many as possible in precision. This means that when possible, using an and a long-term bias estimate is more useful and reliable than a repeatability and a short-term bias estimate.

Figure 2. Dependence of bias on the examined timeframe.


 (Eq 1)
 (Eq 2)
  (Eq 3)
  (Eq 4)
  (Eq 5)
 (Eq 6)
 (Eq 7)
