Validation of liquid chromatography mass spectrometry (LC-MS) methods
2.3. Selectivity examples
Example 1
Not all validation guidelines explicitly specify a required limit for chromatographic peak resolution (RS). In LC-MS an incomplete chromatographic separation of analyte peak from neighbouring peaks may or may not cause problems. Often m/z of analyte differs from that of neighbouring peaks or an unique MRM transition is used. This way the presence of any potentially overlapping peak is simply neglected. However, even though the analytical signals of these interfering compounds are not registered, they can cause matrix effects. Therefore, it is customary to seek for a peak resolution of at least RS ≥ 1.5.
The chromatogram in Figure 1 was recorded while developing a method for analysis of compounds A, B, C and D. One MRM transition is presented for each compound and is shown in different colour. If one hadn’t recorded the transition shown in green, this peak would have been missing from the chromatogram and one wouldn’t have known that compound C (RT 5.33 min) – is present. But this compound could interfere with the detection of other compounds, regardless of whether or not it’s signal is recorded. Therefore, one should make sure that the peak is adequately separated from other peaks.

Figure 1. Initial chromatographic separation of compounds A, B, C and D.
Table 1 presents the chromatographic data for above separation. The peak resolution (RS) from the preceding peak was calculated for the last 3 peaks according to equation 1. It appears that while the separation of the compounds B and C is at the limit (RS= 1.5), then the separation of C and D is not satisfactory (RS = 1.4).
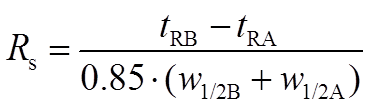 (Eq 1)
Table 1. Peak data of the chromatogram in Figure 1.
| Analyte | tR | w1/2 | RS |
| A | 4.710 | 0.079 | |
| B | 5.102 | 0.094 | 2.7 |
| C | 5.327 | 0.088 | 1.5 |
| D | 5.538 | 0.093 | 1.4 |
The chromatographic separation was further optimized
and the chromatogram presented in Figure 2 was obtained. As a result, sufficient peak resolution (RS > 1.5) has been achieved for all of the analytes (Table 2).

Figure 2. Chromatographic separation of compounds A, B, C and D.
Table 2. Peak data of the chromatogram in Figure 2.
| Analyte | tR | w1/2 | RS |
| A | 4.752 | 0.075 | |
| B | 5.169 | 0.074 | 3.3 |
| C | 5.533 | 0.077 | 2.8 |
| D | 5.856 | 0.088 | 2.3 |
Example 2
As seen in the previous example, while respecting the selectivity-enhancing power of MS, one must not forget the importance of the chromatographic separation. Chromatography becomes crucial if discrimination of isomers – having the same molecular mass – is desired.
For example, two major metabolites of morphine are morphine-3-glucuronide (M3G) and morphine-6-glucuronide (M6G) (Figure 3).

Figure 3. Morphine-3-glucuronide (M3G) and morphine-6-glucuronide (M6G).
M3G and M6G are structural isomers with identical molecular formulae and, consequently, identical molecular masses. In such situation, the discrimination of isomers relies completely on chromatographic separation. A mass spectrometer, even if is a high resolution (HRMS) type, can’t distinguish molecules of identical masses and fragmentation patterns (which is the case of these two compounds). However, M3G and M6G can be conveniently separated chromatographically (Figure 4).

Figure 4. Chromatographic separation of morphine metabolites Morphine-3-glucuronide (M3G) and morphine-6-glucuronide (M6G).
***
(1) There are several options for selectivity optimization in reversed phase LC:
- Percent of organic solvent in the mobile phase
- Organic solvent itself (methanol, acetonitrile, THF or their mixture)
- pH of eluent (note the pH limits of your column; in case of LC-MS only volatile pH-buffer components can be used)
- Different column chemistry and physical properties
- Temperature (the effect is usually small, but may help)