
Validation of liquid chromatography mass spectrometry (LC-MS) methods
7. Accuracy
– relations to different concepts
http://www.uttv.ee/naita?id=23668
https://www.youtube.com/watch?v=iunClGAivzo
Measurement result accuracy indicates its closeness to the true value []. Accuracy differs from : accuracy can be used to characterize an individual result, but trueness always refers to the mean value of a large number of results. Because of that and because accuracy can characterize an individual result, accuracy involves also . So, the accuracy of a method (i.e. accuracy of the results delivered by the method) is affected by a systematic () as well as random (precision) error components and is, therefore, studied as two components: trueness and precision [].

Figure 1. Interrelations between the different error types, the performance characteristics used to estimate them and the ways of expressing the estimates quantitatively. This type of scheme was originally published in ref 56. (See Note 1)
Accuracy, trueness, precision and
http://www.uttv.ee/naita?id=23345
https://www.youtube.com/watch?v=NfEsN1Gaq5k
A number of regulatory bodies (ICH, , EMA) define accuracy as the degree of agreement between the experimental value, obtained by replicate measurements, and the accepted reference value. This definition is identical to the currently accepted definition of trueness. For the evaluation of acceptability of measurement accuracy, different evaluation criteria can be used: En -numbers, z-scores or zeta-scores.
Accuracy is often considered as a qualitative term []. However, in practice it is useful to consider that accuracy is quantitatively expressed as a measurement uncertainty. There are different approaches for the measurement uncertainty estimation, but in practice the approach based on the validation data is often the most convenient. The following video explains the basics of this approach. In-depth treatment of the topic of measurement uncertainty, together with numerous examples and self-tests can be found in the on-line course Estimation of Measurement Uncertainty in Chemical Analysis. Uncertainty estimation on the basis of validation and quality control data is covered in section 10. The Single-lab validation approach.
Measurement uncertainty estimation approaches
http://www.uttv.ee/naita?id=23667
https://www.youtube.com/watch?v=syB2RKAEeMs&t=46s

Figure 2. The main idea of estimating measurement uncertainty using validation and quality control data.
Zeta-scores, z-scores and En numbers
Zeta-scores (ζ-scores) and En numbers [] are used for comparing a measurement result with a reference value (e.g. certified value of a certified reference material or independent reference value of an interlaboratory comparison) or two measurement results against each other, to determine whether they are in agreement. An important condition for using them is that uncertainty estimates are needed for both compared values.
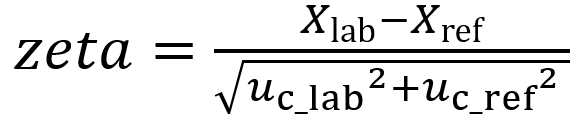
Zeta-scores are calculated as follows:
 (Eq 1)
Xlab is the result obtained by the lab
Xref is the reference value (or the result obtained by another lab)
uc_lab is the combined standard uncertainty of lab’s result
uc_ref is the combined standard uncertainty of the reference value (or the result obtained by another lab)
Agreement between the two results is determined as follows:a
|
zeta-score |
Result |
Action to be taken by the lab |
|
|zeta| ≤ 2 |
Results agree |
None |
|
2 < |zeta| < 3 |
Unclear situation |
Preventative action |
|
|zeta| ³ 3 |
Results disagree |
Corrective action |
a |zeta| denotes absolute value of zeta.
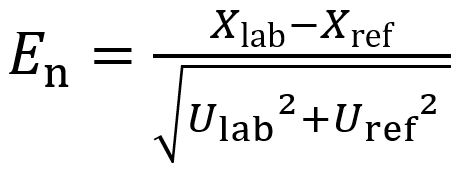
En numbers are calculated as follows:
 (Eq 2)
Xlab is the result obtained by the lab
Xref is the reference value (or the result obtained by another lab)
Ulab is the expanded uncertainty of lab’s result, typically at k = 2 level
Uref is the combined standard uncertainty of the reference value (or the result obtained by another lab), typically at k = 2 level
Agreement between is determined using the following table:a
|
En |
Result |
Action to be taken by the lab |
|
|En| ≤ 1 |
Results agree |
None |
|
|En| > 1 |
Results disagree |
Corrective action |
a |z| denotes absolute value of z.
Z-Scores
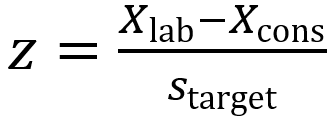
Z-Sores [] are the most widely used measure for evaluating the results of proficiency tests (PT, interlaboratory comparison measurements aiming at evaluating the proficiency of participating laboratories). The main advantages of z-sores against other typical measures – En numbers and zeta-scores – are that there is no need for an independent reference value – a consensus value of the participating laboratories is used instead – and uncertainty estimates of the values are not needed. Calculating the z-score of a PT participant:
 (Eq 3)
Xlab is the participant result
Xcons is the consensus value of the participating laboratories
starget is the target standard deviation
Participant performance is determined using the following table:a
|
z-score |
Result |
Action to be taken by the lab |
|
|z| ≤ 2 |
Good |
None |
|
2 < |z| < 3 |
Warning |
Preventative action |
|
|z| ³ 3 |
Unacceptable |
Corrective action |
a |z| denotes absolute value of z.
To use z-scores the consensus value and the target standard deviation has to be evaluated.
If the intercomparison has no independent reference value then the consensus value has to be evaluated from the participant data. The consensus value is re-evaluated in every round of an intercomparison. Outlying results are eliminated before calculating the consensus value. If this is not done then some strongly outlying results can strongly affect the whole analysis. (See Note 2) Eliminating outliers is not a trivial task. Outlier elimination of an outlier must be based on rigorous statistical tests, not on intuition. Currently there is no one single universally acknowledged way of determining outliers. Grubbs and Cochran tests (see the Exploratory Data Analysis section of the NIST/SEMATECH e-Handbook of Statistical Methods []) are often used. After elimination of outliers, the consensus value is found as the mean or median of the participant results. In the case of median outliers are less influential. For this reason, median is often preferred over mean.
The target standard deviation starget is a quantity that describes the expected variance of the results of the participants. The target standard deviation can be determined in different ways. The actual standard deviation of the participant results after elimination of outliers is the most used way.
***
Note 1: Literature reference in the video has incorrect number of year. The correct reference is as stated here: A. Menditto, et al Accred. Qual. Assur. 2007, 12, 45
Note 2: For example, it is not unusual to have participant values differing from other submitted values by 1000 times. This can happen if mistake is made with units, e.g. a result that should have unit μg kg-1 is presented with the unit mg kg-1.