Validation of liquid chromatography mass spectrometry (LC-MS) methods
5.3 Qualitative estimation of matrix effect
This and the following section will look in more detail at some of the components. Ionization suppression/enhancement (matrix effect), as one of the most problematic issues in LC-MS analysis, receives the most attention, followed by (and the composite of the two – process efficiency). Analyte , another important issue, especially in biomedical analysis, is discussed in a separate section 8.
Qualitative estimation of matrix effect
http://www.uttv.ee/naita?id=23477
https://www.youtube.com/watch?v=zZNIkDy9a-Y
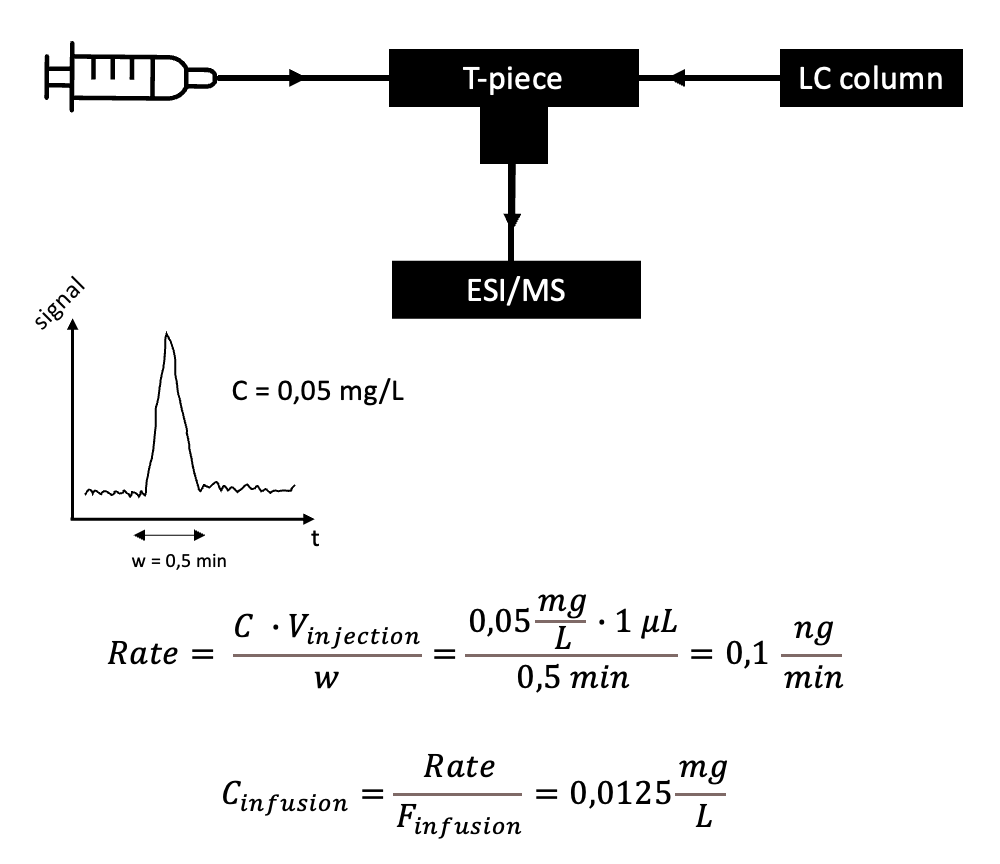
The first method of qualitative estimation of the matrix effect is based on detecting the presence of ionization suppression (1) by recording the matrix effect profile with post-column infusion []. For this the blank sample extract – which does not contain the analyte – is injected into the LC. At the same time, a stream of analyte solution is mixed with the chromatographic effluent exiting the column (post-column mixing) and the mixture is delivered into the ion source. The MS monitors the analyte signal.

Figure 1. The experimental setup for recording the matrix effect profile.
The same is done while injecting a blank solvent into the LC column. If no suppression is present, then the analyte MS signal intensities are equal for the sample and solvent injection within the of the MS signal. For the retention time region where the ionization suppression occurs, the MS signal in the sample injection decreases. In order to have a method not affected by an ionization suppression, the analyte peak should elute away from the suppression region. This approach does not enable quantitative evaluation of the ionization suppression/enhancement but only enables confirmation of its presence/absence and this is very useful for tuning the chromatographic separation of the analyte and possible compounds causing ionization suppression.
The most recent validation guideline proposes an evaluation of ionization suppression by assessing the parallelism of dilution plots [].
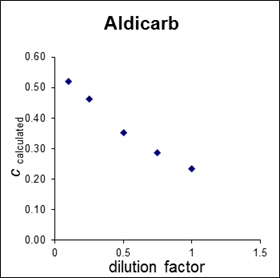
We suggest building these plots using axes “calculated analyte concentration” vs “dilution factor” (defined as Vsample/Vsum).

Figure 2. Example dilution plot of Aldicarb determination in garlic.
From these plots, matrix effect occurrence can be observed as a decrease (enhancements) or an increase (suppression) of the calculated concentration with a decreasing dilution factor. For example, on a plot given above, Aldicarb is experiencing strong ionization suppression, that decreases with dilution.
This approach is also applicable if blank matrices are not available, although no quantitative conclusions can be made based on the comparison of dilution curves.
(1) The following text is relevant for both ionization suppression and enhancement. However, since ionization suppression is significantly more common, we occasionally use only the term “suppression” in the following text.


