Validation of liquid chromatography mass spectrometry (LC-MS) methods
2.1. Selectivity: LC selectivity
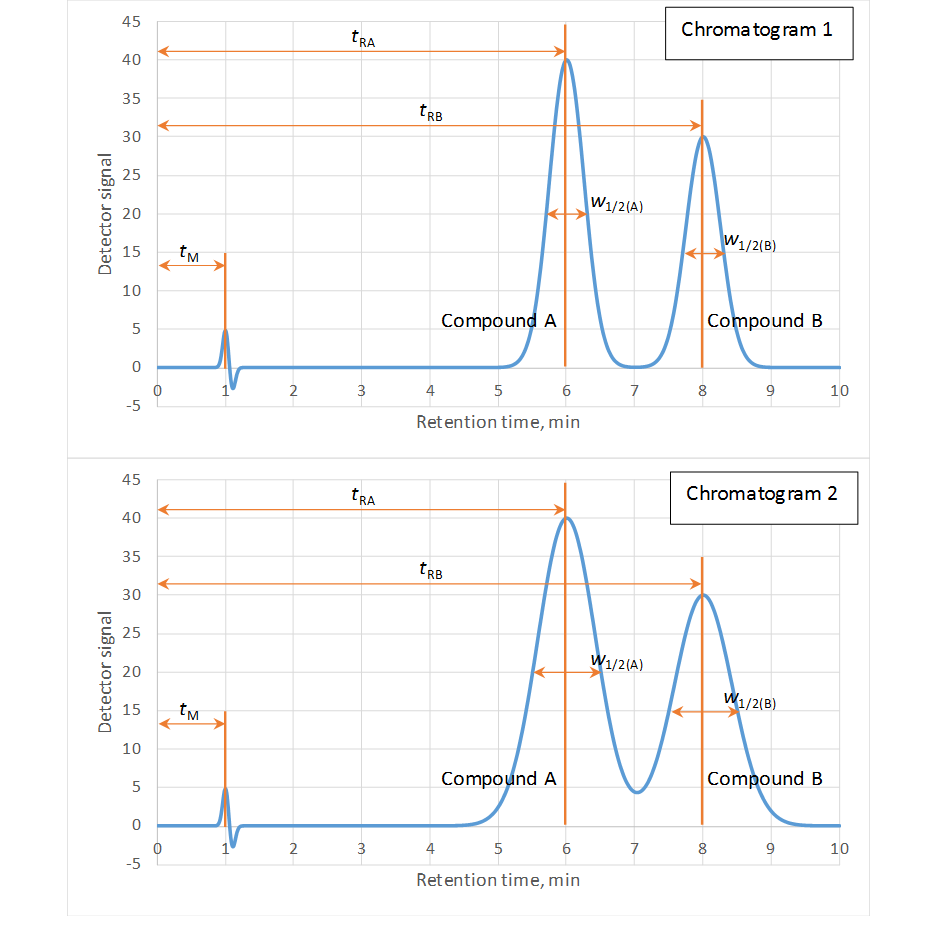
There are a couple of ways to characterize how well chromatographic peaks are separated/resolved. Probably the best known parameter is the separation factor (aka factor) – α. For the two peaks on the chromatograms in Figure 1, a separation factor is calculated as follows (follows (tRA tRB are retention times of, respectevely, compounds A and B; tM is hold-up time – time for an unretained compound to reach the detector):
 (Eq 1)
The larger the separation factor, the farther apart are the peak maxima. Separation factors for chromatograms 1 and 2 in Figure 1 are equal, but visually it is clear that the peaks in chromatogram 2 are not completely resolved. This is the main drawback of a separation factor as numerical characteristic of chromatographic separation – it only characterizes peak separation in terms of retention times, but not peak resolution in terms of lack of overlap.

Figure 1. Chromatograms with a similar separation factor but different resolution.
The second possibility of quantitatively expressing chromatographic selectivity is using the peak resolution, Rs. in addition to retention times Rs takes into account peak widths at half height, w1/2:
 (Eq 2)
Peak resolution in chromatograms 1 and 2 (Figure 1) are calculated as follows:
Chromatogram 1: 
Chromatogram 2: 
Different Rs values reflect the actual situation – peaks in chromatogram 1 are better resolved than in chromatogram 2.
In order to numerically express selectivity, some validation guidelines require demonstrating that peak resolution exceeds certain threshold. For example, requires Rs > 2 and requires Rs > 1.5. In addition to demonstration of suitable peak resoluton, AOAC (also ICH) requires that no other compound should be detectable at the analyte retention time, when methods like IR, NMR or MS are used. To check for the presence or absence of coeluting compounds, Eurachem suggests a demonstration of separation on a column of different chemistry.
Introduction to selectivity and . Chromatographic (LC) selectivity.
http://www.uttv.ee/naita?id=23251
https://www.youtube.com/watch?v=uE-qjB0w4Y4&t=332s
Note that current version of FDA guideline does not directly specify resolution Rs.


