Validation of liquid chromatography mass spectrometry (LC-MS) methods
9.2. Decision limit and Detection capability
Decision limit (CCα) and detection capability (CCβ)
http://www.uttv.ee/naita?id=23306
https://www.youtube.com/watch?v=posQ05DUCIc&t=1s
As mentioned in the previous section, by definition may or may not take into account both (results where the analyte is declared to be present although actually it is below LoD) and (results where analyte is declared to be below LoD although it is not) errors at the same time.
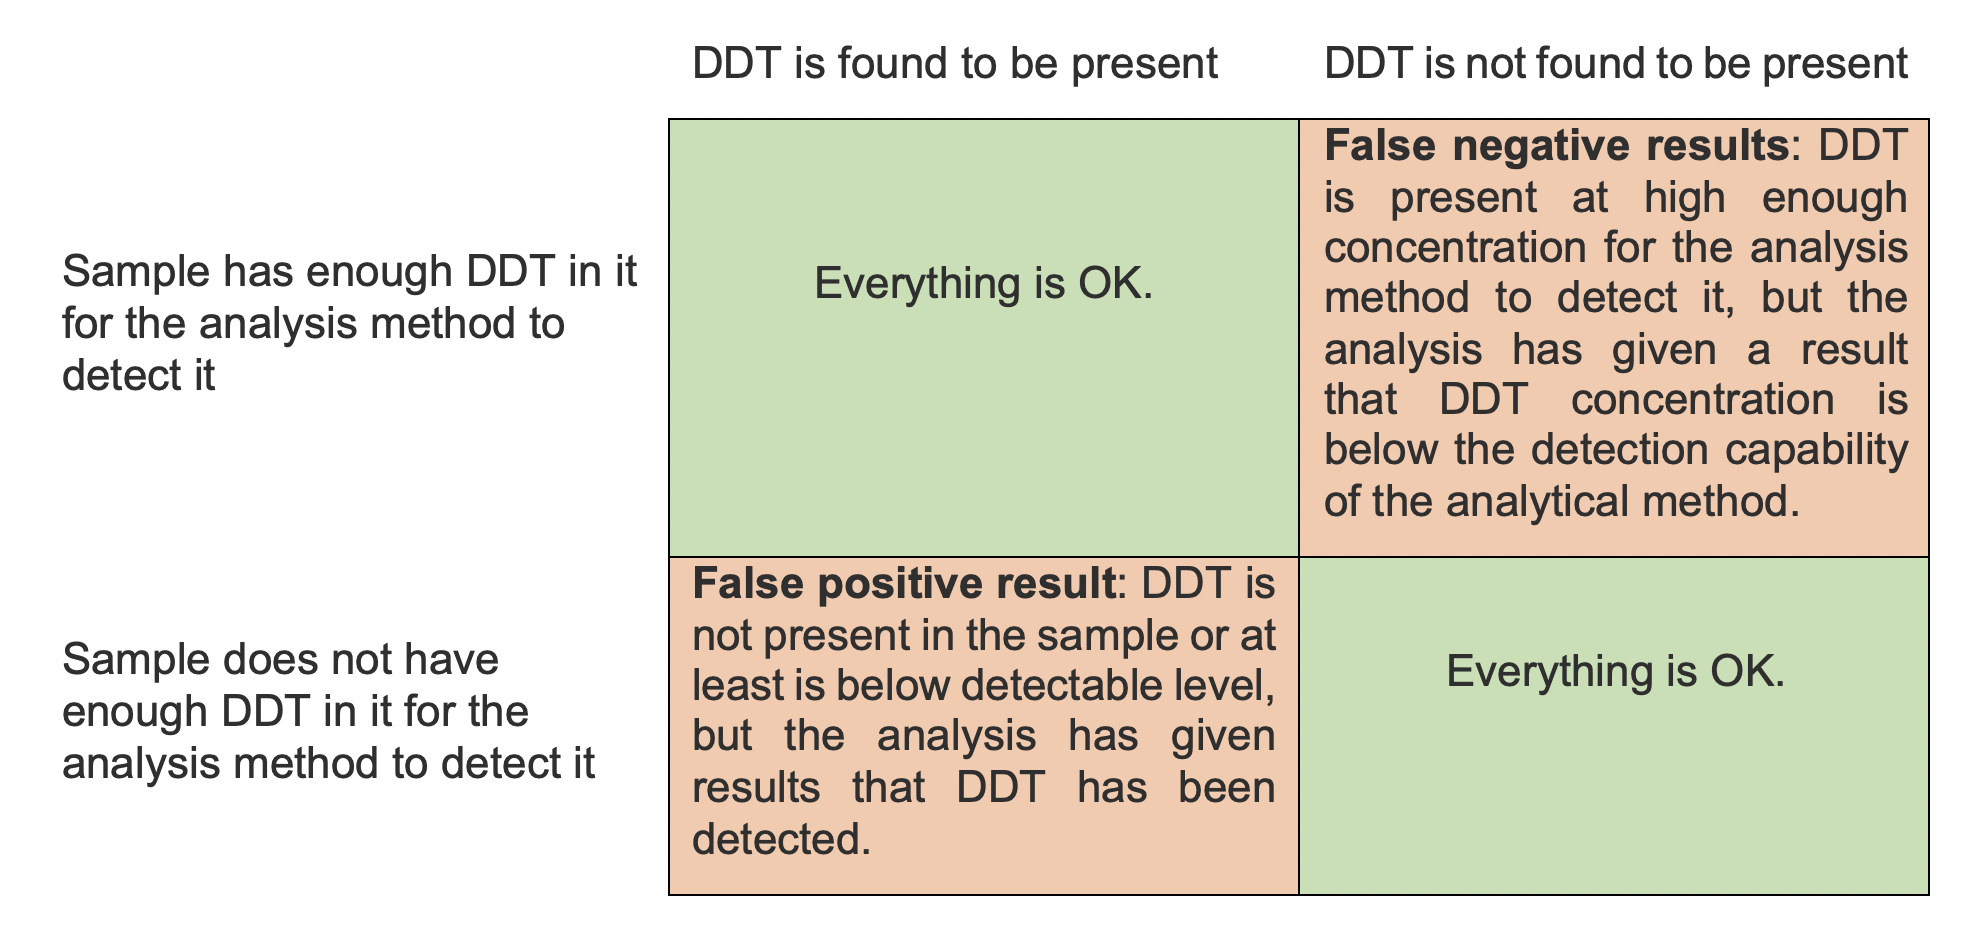
An example is given in Table 1 to better explain the concept of false positive and false negative results on the basis of a widely banned pesticide DDT (dichlorodiphenyltrichloroethane). The concentration of DDT is compared to the capability of the analytical method.
Table 1. Explanation of false positive and false negative results.

To account for both of these errors, Currie [] suggested to use two different quantities: decision limit (CCα) and detection capability (CCβ). For example, when validating the analysis method for measuring DDT, it was found that CCα was at 0.005 μg/L. Therefore, if a higher result than 0.005 μg/L is received from the analysis there is ≤ 5% probability that the result is just noise (noise can be defined as signal received when no analyte is present or the analyte concenrtation is so low that the analysis method cannot detect it). If we are relatively certain that the results are not simply noise, then we can say that we have detected DDT. In other words, CCα can be considered as the concentration at which we can decide that we are not measuring noise but we are receiving a signal from the analyte.
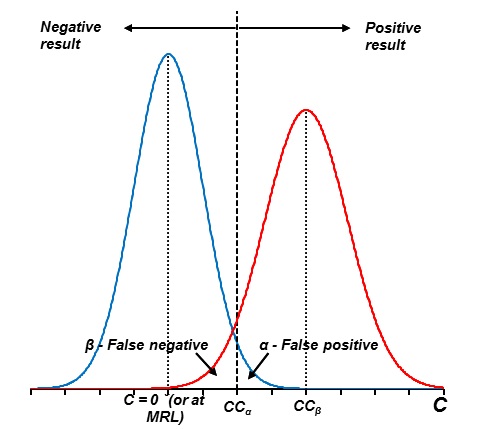
CCα is defined as the concentration level, as determined by the method, at which there is probability α (usually defined as 0.05 or 5%) that a blank sample will give a signal at this level or higher. CCβ is defined as the concentration level of the analyte in sample at which there is a probability β (again usually defined as 0.05 or 5%) that the method will give a result lower than CCα, meaning that the analyte will be declared as undetected (although the analyte content in the sample is in fact higher than CCα, see Figure 1 for illustration of CCα and CCβ definitions).
For example, in the example of DDT analysis method, CCα was found to be Y. This means that if a single measurement of a sample is above Y then the probability that the measurement is just noise, is ≤ 5%. Because of random variability of results, even if DDT is present in the sample at a concentration above CCα, there is the possibility that we receive a result that is below CCα and therefore interpret the result as negative (see the red curve in Figure 1). Therefore, we need to find CCβ where the probability for this kind of false negative probability is small, in our example ≤ 5%.
By these definitions, if the analyte is present at concentration of CCβ (or above) it can be said with good certainty that the measurements are not simply noise (which otherwise would lead to false positive results) and that the analysis method can measure this concentration with only small probability of giving results below CCα (i.e. false negative results).

Figure 1. Relation between permitted limit, CCα and CCβ
It must be noted that in some cases the name “limit of detection” is used in place of CCβ. When dealing with LoD, the precise definition under question must be clarified. Although in most cases LoD can be considered equal to CCβ this is not always the case. The approaches to calculate LoD make many assumptions about the properties of the system – e.g. and . The approaches given by standards to estimate CCα and CCβ are usually provide more complex and do not make the same assumptions. Therefore, in principle LoD and CCβ could be considered equal, but their values cannot always be compared in a meaningful way.
If the value has been set for the analyte in the particular sample, then the following should be considered: (a) the MRL value should be above the CCβ or LoD value (see Section 9.1), and (b) the analyte concentration should be estimated where it can be said with known confidence (taking into account both false positive and false negative probabilities) that the concentration of the analyte is above the MRL. For the second part, CCα and CCβ must be evaluated not for 0 concentration but at the MRL level (see Figure 1 where C = 0 or at MRL). It should be noted that for example Council Directive 96/23/EC has defined CCα and CCβ so that if a MRL is set, these values are not used to estimate the minimum amount that the method can detect, but for estimating when the result is over or under the MRL value. The same approaches to estimate CCα and CCβ can be used.
In Figure 1, a normal distribution is used only to clearly and simply explain the concept of CCα and CCβ. It has been shown that often results from blank and very low concentration samples do not have a normal distribution. Moreover, it is more correct to use a t-distribution rather than a normal distribution in case if only a small number of replicate measurements are made. In addition, it should be noted that the data is heteroscedastic (width of the distribution is wider at higher concentration) in Figure 1 and homoscedastic (width of the distribution is same at both concentrations) in the video “Decision limit (CCα) and Detection capability (CCβ)”.
Interpreting results with and
http://www.uttv.ee/naita?id=23349
https://www.youtube.com/watch?v=DP1wAdmXkIg
With CCα and CCβ, the results must be interpreted in the following way: (a) in case the result is below CCα, it must be reported that the analyte concentration in the sample is below CCβ (this is so because it is not known whether our result is falsely negative or truly under CCα), (b) in case the result is over CCα, but below CCβ, the sample can be said to contain the analyte with good probability, and (c) in case the value is over CCβ, then the same statement can be made as in the point (b).
However, only the CCβ value can be used for the characterization of the method as at CCβ we take into account the possibility of both false positive and false negative error.


