Validation of liquid chromatography mass spectrometry (LC-MS) methods
3.3. Estimating the linear range
, different ranges
http://www.uttv.ee/naita?id=23250
https://www.youtube.com/watch?v=uc6ZqIKC-Qc
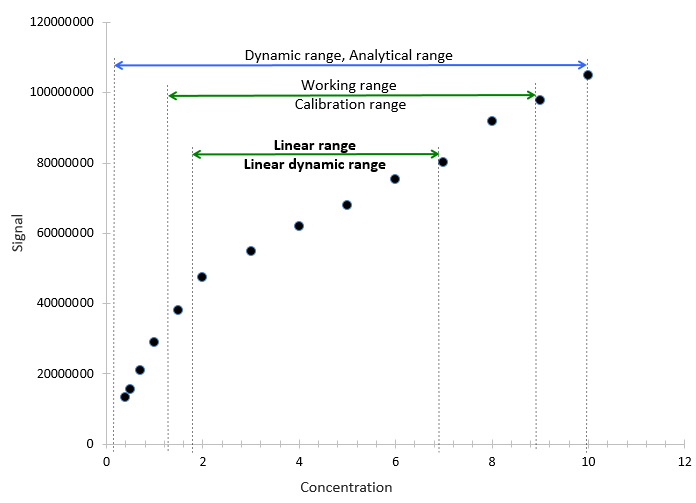
– In the dynamic range, the response changes when the analyte concentration is changed but the relationship may be non-linear. If a response is linear, it can be specified as a dynamic linear range. (1)
– The working range is the range where the method gives results with an acceptable uncertainty. A working range can be wider than a linear range. []
This means that there is a correlation between the analyte concentration and the instrument’s signal and concentrations of the analyte can be determined within this range – from to anomalies of the .
Calibration range – The calibration range is the interval between the upper and the lower concentration of the analyte which can be determined with the demonstrated , and response function. []
Linear range or linear dynamic range – The range of concentrations where the signals are directly proportional to the concentration of the analyte in the sample.

Figure 1. Different ranges
should be confirmed for the expected working range, including the chosen matrix. A linear range can be found from the linearity assessment experiments, however, the criteria for a linear range can be different. A linear range should cover 0–150% or 50–150% of the expected analyte concentration.
While a linear range for the LC–MS instruments is usually fairly narrow (and depends on the compound), several possibilities have been used in order to widen a linear range. Using the isotopically labeled internal standard (ILIS) is one of them. While the signal-concentration dependence of the compound and an ILIS may not be linear, the ratio of the signals may be linearly dependent on the analyte concentration. But even then, care has to be taken when working outside of a linear range of the signals.
One way of increasing a linear range is by working at the lower concentrations (and diluting samples), if the analyte signal is intense enough. Another way to increase a linear range, specifically in the case of a LC-ESI-MS, is to decrease the charge competition by lowering the flow rate in the ESI source, e.g. by using a nano-ESI.
***


