MOOC: Validation of liquid chromatography mass spectrometry (LC-MS) methods (analytical chemistry) course
1.5. Uploading data in ValChrom
In this section we will upload our first dataset into ValChrom. Data can be uploaded in two main ways:
- Copy from a file and paste into ValChrom
- Uploading a file (.xlsx, .csv, etc.)
In this MOOC you can use ready-made files for the problems presented in ValChrom-based self tests. Links to these files can be found within each such test.
Experimental Datasets
Experimental Datasets are used for holding results of experiments, which were carried out according to the Experimental Plan. The user can start populating a dataset when experiments for some validation parameter have been carried out, e.g. one can start assessing when respective measurements are completed without the need to wait for all the rest of data to become available.
- Sections > Experimental Datasets.
-
Click on the large + sign at the right bottom of the window.

- Insert Dataset name: MOOC dataset
-
Select an Experimental Plan: MOOC experimental plan
(If not available, then check that Experiment plan status is “COMPLETE”) - Click “Next”. You will be directed to upload view, where you can choose under which specific assessment method you want to upload data.
Data must to be uploaded for each assessment method separately. Click on “Click to upload” button or drag the file onto the button. Next we’ll follow this with example data.
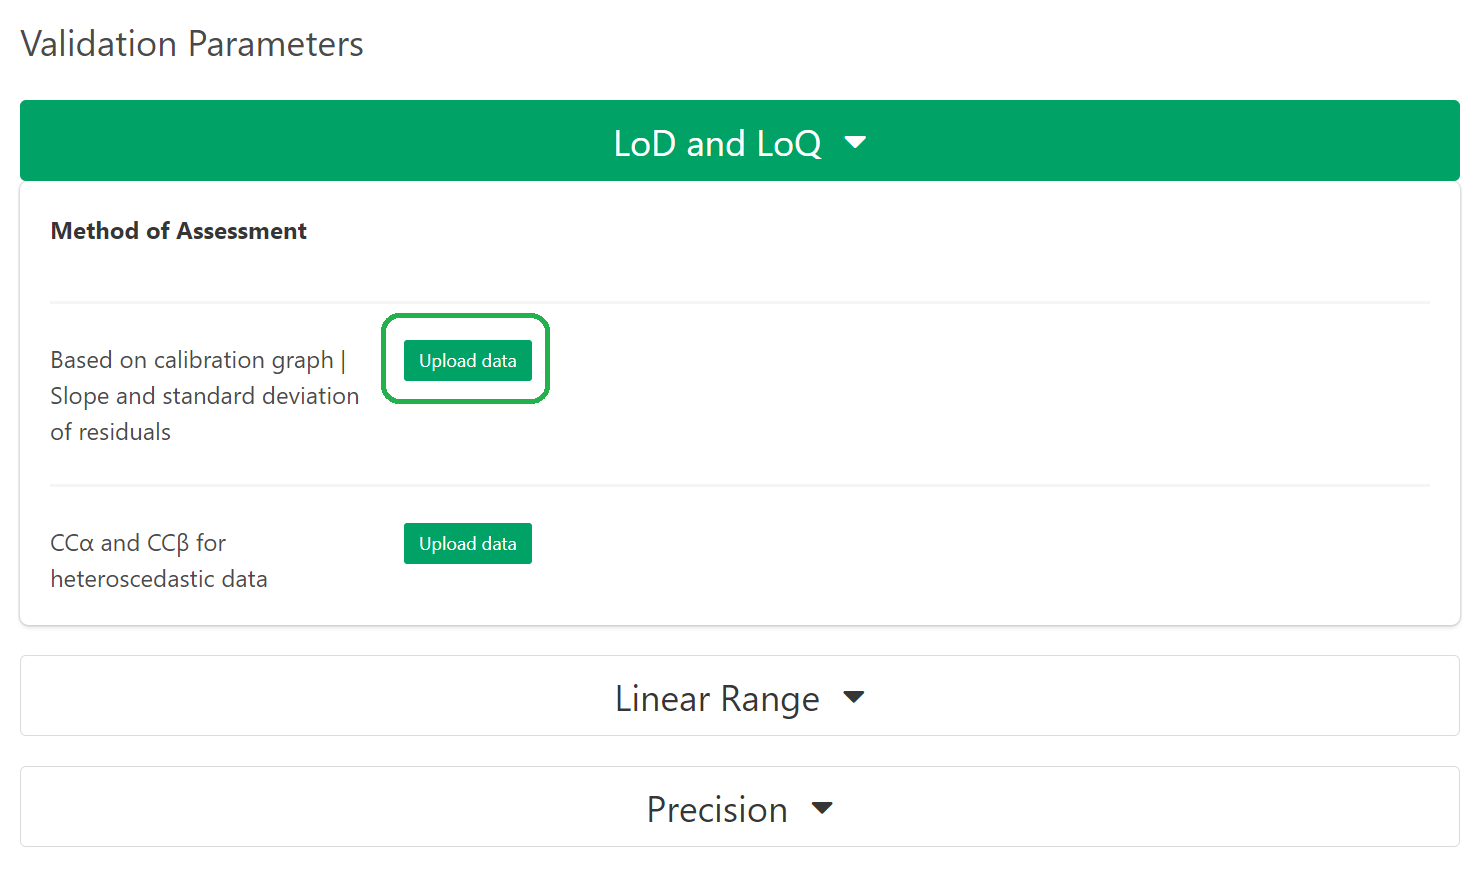 Choose assessment method “Based on calibration graph | Slope and standard deviation of residuals” by clicking “Upload data” button. You will be directed to data upload view.
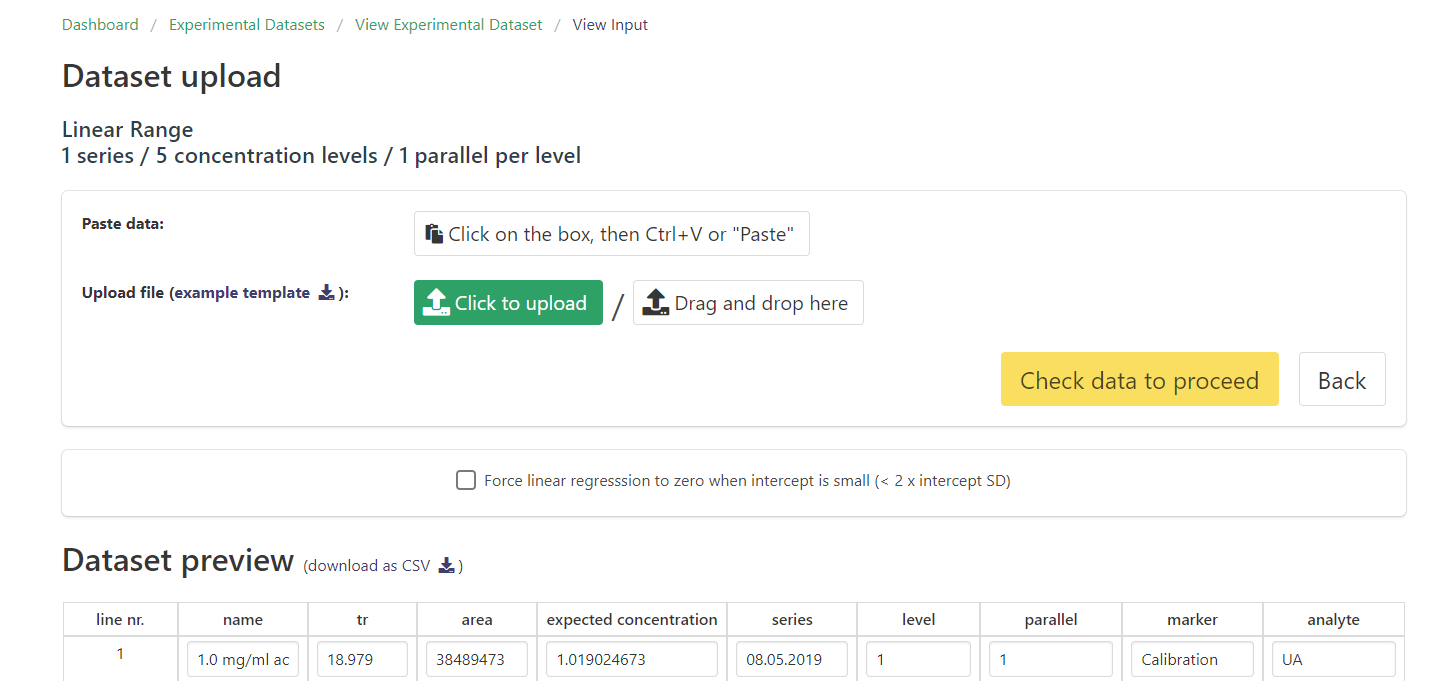
Next we will go over the two ways to upload data.
Uploading data by copying from file
In order to copy data:
- Download the “test_data.xls” file with raw data: test_data.xls and open the file.
- Copy the data from the file.
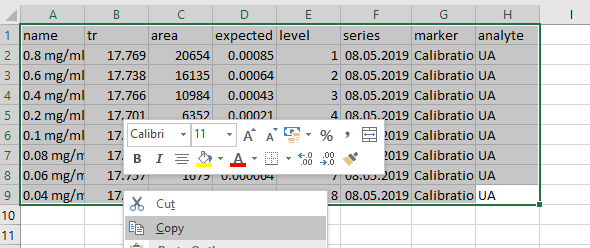
3. Click on the field with “Click on the box, then Ctrl+V or “Paste””, so that a cursor appears there.

4. Paste your data (Ctrl + V).
5. You will see your data appear below at “Dataset preview”. Here a quick glance at the data should be made in order to fix obvious errors immediately.
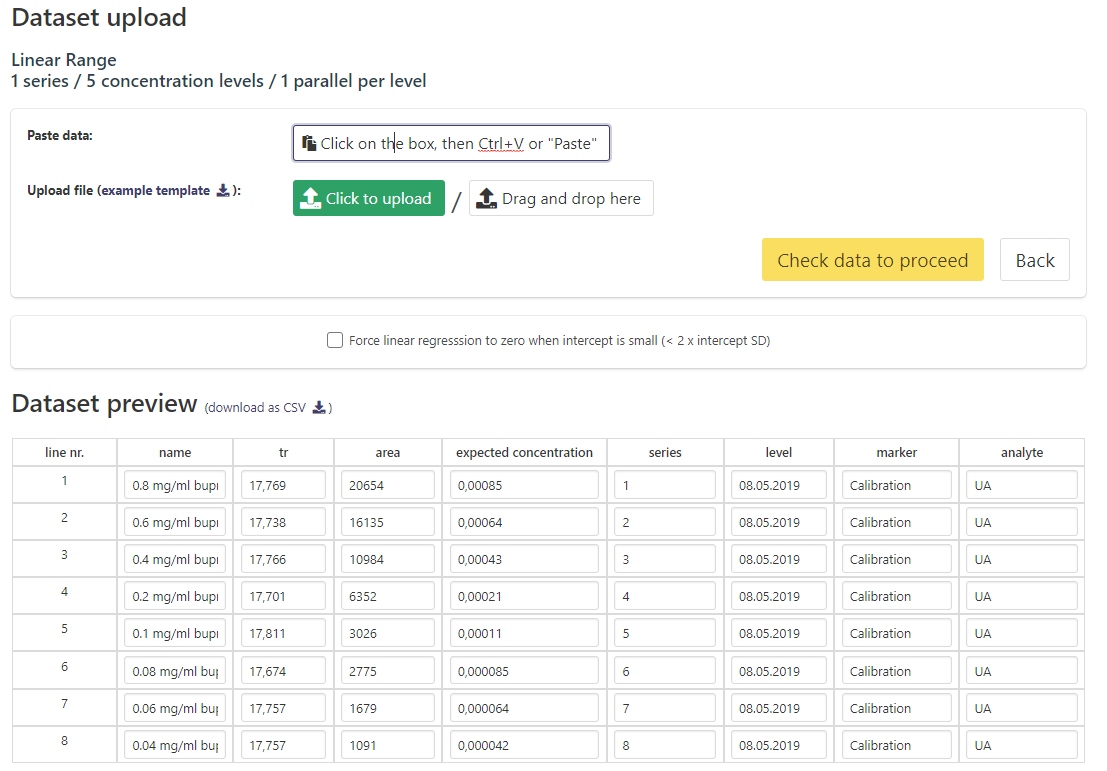
6. Click “Check data to proceed” to check if all data is present.
7. Also, a button “Show results” appears. Clicking this button will direct straight to the calculated results (see section “Overview” below). Clicking “Back” takes you back to “Upload Experimental Dataset” page.

Uploading a file
In order to upload a file:
1. Download the “test_data.xls” file with raw data: test_data.xls.
2. Click on the “Click to upload” button to find the file with the data.
3. Alternatively, you can drag and drop the file on the button.

4. From here on follow point 5. and onward in previous section “Uploading data by copying from file”.
Overview
Overview is divided by validation parameter. Every validation parameter is presented in two sections: Overview and Detailed view. At once results for one analyte are shown. Clicking on a specific validation parameter will open Overview for it.
In Overview only very few data are shown, generally representative of all series or the outcome of the assessment method. For example, in case of and this would be the overall LoD and LoQ values of the assessment method (taken as the maximum (conservative) values, if there are several series to choose from). In case of , overview would have pooled standard deviation calculated over all series data. Detailed View offers all data available: input data and calculated results with graphs, if applicable.
1. Go to Overview either by clicking “Show Results” button after uploading the data.
2. Alternatively, you can go to Sections > Experimental Dataset. Find your dataset and click on Overview button or the Dataset name.
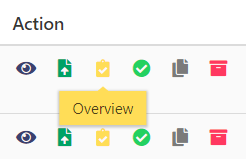
3. You will see overview divided into several sections based on validation parameters. Clicking on a validation parameter will show Overview for assessment methods.
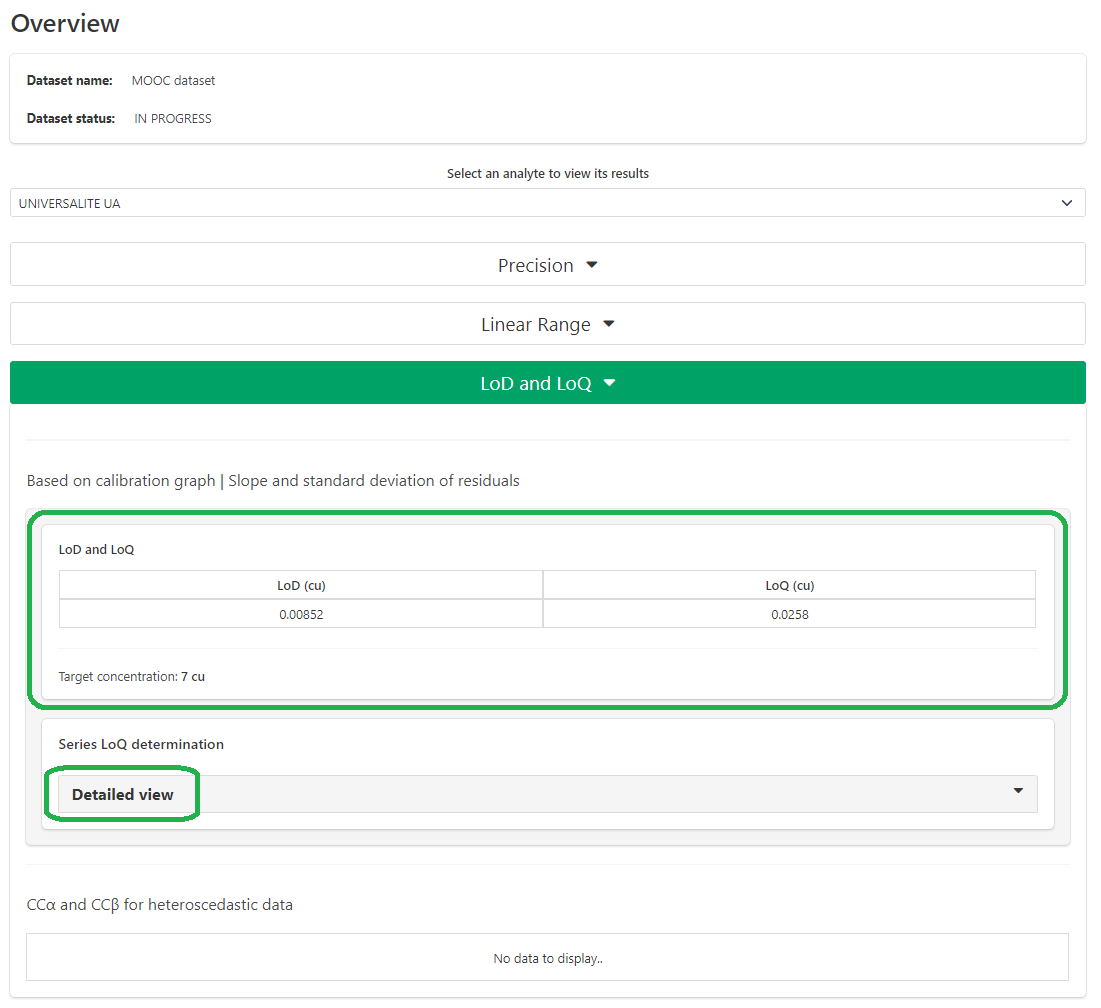
4. Click on “Detailed View”.
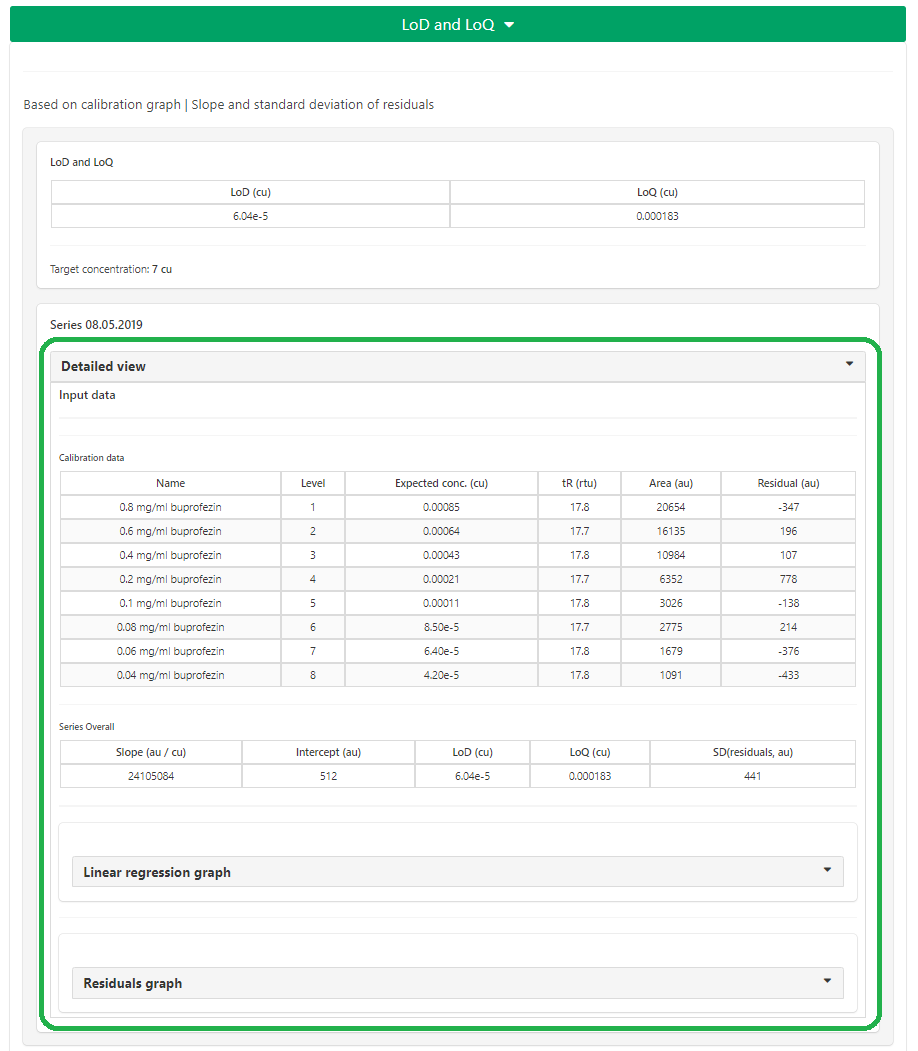
5. You can now see the automatically calculated results for the test data! In the “Input data” table the raw data used for the calculations can be seen, together with some calculated results for each table row (e.g. residuals). In “Series overall” table data calculated from the whole series is shown (e.g. LoD and LoQ values, or standard deviation of residuals: SD(residuals)). Try clicking on “Linear regression graph” or “Residuals graph”.
6. Note on MS Excel and programming languages : Excel is following double-precision floating-point format from the IEEE 754 specification. Strictly following the IEEE 754 specification causes some loss of precision, as can be seen from Microsoft´s documentation on the topic [ref: https://docs.microsoft.com/en-us/office/troubleshoot/excel/floating-point-arithmetic-inaccurate-result]. Excel (and other spreadsheets) only store first 15 significant digits and all others are lost. In most practical circumstances this is not noticed nor relevant. However, in cases where raw data has many significant digits this imprecision will carry over to calculated results, like in case of large areas and unrounded theoretical concentrations with a lot of significant digits (e.g. 0.173240255623636). You can test this with the following data in ValChrom (or R/Python/Java): Excel_vs_Python_vs_Java_vs_R_RSS.xslx
In most usual cases the amount of significant digits does not get large enough and/or the differences can mostly be observed in the 8th and beyond significant digit of the answer, so that very rarely in case of large unrounded numbers (slopes, RSS, etc.) can these differences be seen. In the examples of this MOOC the data provided is not meeting any of the extreme criteria, thus Excel and ValChrom will give the same answers.
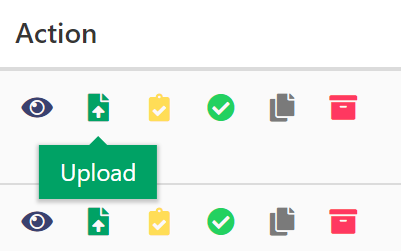
NB! Later in the course you’ll upload data files under the same assessment methods – ValChrom will overwrite previously uploaded data. Use action button Upload under datasets table for this purpose.
Well done! This concludes our introduction into uploading data in ValChrom.


