This exercise is based on exercises 10.2 and 10.3, it is their combination.
A laboratory wants to estimate the measurement uncertainty of protein content determination in different foods. For this protein content in a control sample of smoked sausage was determined repeatedly during a time period of almost one year. Every day when this smoked sausage was analysed only one parallel measurement was made. The following results were obtained:
| Week | Result (g/100g) |
| 3 | 18.1 |
| 5 | 20.5 |
| 11 | 18.3 |
| 14 | 19.1 |
| 15 | 19.3 |
| 27 | 20.2 |
| 34 | 19.7 |
| 41 | 19.5 |
| 42 | 18.6 |
| 48 | 20.1 |
In addition the laboratory analysed two certified reference materials: Ham with protein content (19.6 ± 0.6) g/100g (
k=2, norm) and cheese with protein content (26.3 ± 0.7) g/100g (
k=2, norm). The laboratory has carried out four bias determinations with the following results (each found value is found as a mean from a number of parallel measurements):
| Reference (g/100g) | Found value (g/100g) |
| 26.3 | 26.9 |
| 26.3 | 27.2 |
| 19.6 | 20.1 |
| 19.6 | 20.4 |
Please calculate the combined standard uncertainty of the protein determination procedure (please give 1 or 2 decimals). Absolute uncertainties can be used in this case.
The reproducibility component is found as the standard deviation of the results obtained on different days.
The bias component is found as follows:

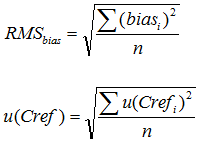
For finding the RMSbias and u(Cref) the bias values from the individual bias determinations (four altogether) and combined standard uncertainties of the reference materials used for the individual determinations (again, four altogether) have to be combined using the root mean square approach:

The individual bias values are found as differences of the lab value and the reference value. The combined standard uncertainties of the reference values can be found by dividing the expanded uncertainties with the coverage factor.
The individual bias values are (all in g/100g): 0.6, 0.9, 0.5, 0.8. The RMSbias found from these data is 0.7176 g/100g (decimal places are deliberately given in excess).
The individual u(Crefi) values are (all in g/100g): 0.35, 0.35, 0.3, 0.3. The u(Cref) found from these data is 0.3260 g/100g (decimal places are deliberately given in excess).
The u(bias) found from these data is 0.7882 g/100g (decimal places are deliberately given in excess). u(bias) is not yet the final uncertainty but rather an interim result for future calculations, so it should not be rounded to 1 or 2 significant digits.

