Estimation of measurement uncertainty in chemical analysis
3.5. Rectangular and triangular distribution
Brief summary: Rectangular distribution and triangular distribution are explained, as well as how the uncertainties corresponding to rectangular or triangular distribution can be converted to standard uncertainties. Often the information on distribution function is missing and then usually some distribution function is assumed or postulated. Rectangular and triangular distributions are among the most common postulated distribution functions. Recommendations are given, which of these distributions to assume.
Other distribution functions: rectangular and triangular distribution
http://www.uttv.ee/naita?id=17584
https://www.youtube.com/watch?v=g_PefybO2Ao

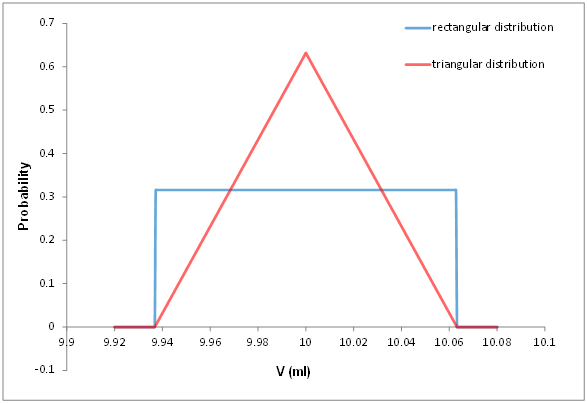
Scheme 3.3. Rectangular and triangular distributions. Both of them correspond to the situation (10.000 ± 0.063) ml.
In measurement uncertainty estimation situations often occur where it is necessary to make choice between two alternatives of which one may possibly lead to somewhat overestimated uncertainty and the other one to somewhat underestimated uncertainty. In such situation it is usually reasonable to rather somewhat overestimate than underestimate the uncertainty.


