MOOC: Instrumental analysis of cultural heritage objects
3.1. IR Spectroscopy
In this course, a general introduction to FT-IR spectroscopy will be given. Based on the types of materials (paints, varnishes, textiles, conservation materials, etc.), practical tips, examples and short explanation of interpretation of IR spectra of organic and inorganic materials will be presented. Capabilities of ATR-FT-IR spectroscopy and FT-IR microscopy (or IR microscopy) for analysing real-life samples taken from historical and archaeological objects will be demonstrated.
1. General aspects of Infrared (IR) spectroscopy
IR spectroscopy was first widely used by chemists in the 1950s. The advent of Fourier transform infrared spectroscopy (FT-IR) in the 1980s revolutionised the field with a high signal-to-noise ratio and good resolution. Since then, FT-IR has became commonly used for the analysis of artistic samples [1]. Various advantages of Fourier Transform Infrared Spectrometer, as well as different sampling techniques and operation, modes enable investigation of different types of materials and perform high-level qualitative and quantitative analysis.
FT-IR spectroscopy has several advantages as a chemical analysis technique [2–4]:
- It is a universal technique: solids, liquids, gases, powders, polymers are all routinely analysed. IR spectroscopy gives useful information about organic and also inorganic compounds.
- IR spectra are information-rich: the peak positions, intensities, widths, and shapes in a spectrum provide useful information.
- IR spectroscopy is a fast and relatively inexpensive technique.
- IR spectra can be obtained with minimal to no sample preparation.
FT-IR spectroscopy also has some disadvantages [4]:
- In the IR spectrum of the complex mixtures, the absorption bands usually overlap.
- Complex mixtures are generally impossible to analyse without reference IR spectra of pure materials.
- IR spectroscopy is not a very sensitive technique.
1.1. Infrared (IR) spectroscopy: fundamentals
Infrared (IR) spectroscopy is a vibrational spectroscopy technique which provides information about characteristic molecular vibrations, from which structural information about materials can be elucidated. IR spectroscopy is a powerful approach for analysing various organic and inorganic materials because, with the exception of some homonuclear molecules (O2, N2, Cl2), most materials absorb infrared radiation. Most of the cultural heritage materials (paints, varnishes, fibres, clays, polymers, synthetic glues, etc.) can be analysed with IR spectroscopy.
The infrared (IR) spectral range is in the electromagnetic spectrum between the visible and microwave regions [5] and extends from 14000 cm–1 to 10 cm–1. It is divided into three regions: the near-infrared [14000–4000 cm–1 (0.7–2.5 μm)], mid-infrared [4000–400 cm–1 (2.5–25 μm)] and far-infrared [about 400–10 cm–1 (25–1000 μm)] [2,6]. The most frequently used region for chemical analysis, especially for the qualitative analysis, is the mid-infrared region. The far infrared region is useful for molecules containing heavy atoms such as inorganic and metal-organic compounds. Also the lattice vibrations in crystals are found in the far infrared region [4].
Infrared spectroscopy is a vibrational spectroscopy: infrared radiation lies in the same frequency range as the vibrational frequencies of molecules. All molecules have a set of specific frequencies at which they vibrate corresponding to discrete energy levels (vibrational modes). There are three types of vibrational modes in molecules: stretching, bending and torsional modes [5]. In order for a vibrational mode to be active in the infrared region, the vibration must cause oscillation of the permanent dipole moment of the molecule. The alternating electrical field (oscillating electromagnetic field) of the radiation interacts with fluctuations in the dipole moment of the molecule. If the frequency of the radiation matches the vibrational frequency of the molecule then radiation can be absorbed, causing a change in the amplitude of molecular vibration (in quantum mechanical terms: molecule transits from its vibrational ground state to an excited state). [2,7,8] The IR spectrum provides energy/frequency information about the IR radiation absorbed or transmitted, which is related to its molecular structure and can be highly characteristic [7].
In chemical analysis infrared spectroscopy is almost exclusively used as absorption spectroscopy. When infrared (IR) radiation is passed through a sample, the frequencies corresponding to the active vibrational modes of the molecules of the sample are, to some extent, absorbed, while other frequencies are transmitted through the sample without being absorbed by the sample [5,8]. The absorption intensity depends on the probability that the infrared photon energy is transferred to the molecule, which in turn depends on molecular structure: the intensity of the absorption band is proportional to the square of the rate of dipole moment change during the vibration. [4,6,7] In simplified terms, it can be said that the higher is the polarity (i.e. dipole moment) of a bond and the larger is the number of such bonds in a molecule, the more intense is its stretching vibration signal observed in the IR spectrum. Examples:
- C=O bond is highly polar and its stretching vibrations are often among the strongest signals in the IR spectrum.
- C-H bonds have low to medium polarity, but because in typical organic molecules, there are lots of C-H bonds, the signals corresponding to their stretching vibrations are often among the strongest in the IR spectrum.
C=C and C-C bonds have low polarity and their bonds are mostly either very weak or undetectable in the IR spectrum.
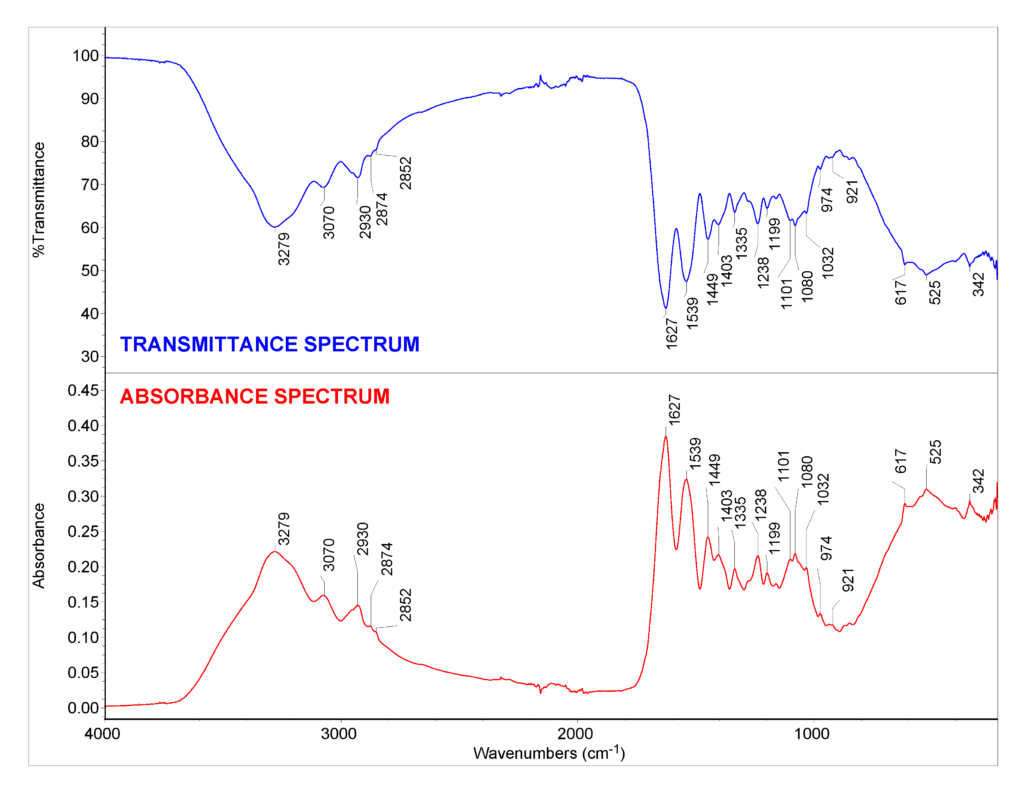
In complex samples, radiation of a large number of various wavelengths can be absorbed depending on the chemical composition of the sample. The instrument output is an IR spectrum (see Fig 1.) in which the intensity of IR radiation absorbed or transmitted is plotted on the y-axis against frequency or wavenumber (or wavelength) of the radiation on the x-axis [7]. In infrared spectroscopy, units called wavenumbers are normally used to denote different types of radiation. The wavenumber, usually expressed in cm–1, is the number of waves that fit into 1 cm and is the reciprocal of wavelength in cm. [2,7]
In the following video, the fundamentals of IR spectroscopy are shortly explained and examples are given.
1.2. Infrared (IR) spectroscopy: basics of instrumentation
Two major designs of IR spectrometers exist: dispersive spectrometers and Fourier transform spectrometers [9]. Nowadays, the prevalent type is the Fourier Transform Infrared Spectrometer (FT-IR) and we limit our discussion to this design.
The main components of FT-IR spectrometer are presented on the following scheme:

I0 – Intensity of radiation entering a sample
I – Intensity of radiation transmitted by the sample
The heart of an FT-IR instrument is a two-beam Michelson Interferometer. In the interferometer, the IR beam is split in two using a half-transparent window known as the beamsplitter. The two beams travel different distances (and the difference is gradually changed). The beams are thereafter merged into one, and because of interference, it will be a pulsating beam. And very importantly, the pulsation pattern will mimic the pattern of frequencies in the IR beam reaching the detector. The interferometer is controlled by the frequency of a visible light laser. In general terms, FT-IR is a method of obtaining infrared spectra by first collecting an interferogram (time-domain spectrum) of the sample signal using Michelson Interferometer. Then a mathematical transformation, called the Fourier Transform (FT), is applied to the interferogram to obtain the frequency domain spectrum. This spectrum is then compared to a reference spectrum measured without the sample (called background) to obtain the absorbance or transmittance spectrum, which are the spectrum types, commonly used for chemical analysis (Fig. 1). [2,4,6,7]
In the FT-IR spectrometer, radiation containing all thr IR spectrum frequencies emitted by the IR source (thermal sources are usually used, for example, Globar®) reach the detector (e.g. DTGS or MCT) simultaneously and are converted to the IR spectrum. This results in considerable time saving (the Fellgett advantage) and much higher signal-to-noise ratio advantage (Jacquinot’ advantage) over dispersive instruments [6]. Additionally, the wavenumber scale of an FT-IR instrument is reliably fixed by the wavelength of the controlling laser (Connes’ advantage). This enables performing multiple scans and averaging the spectra to further improve the signal-to-noise ratio.
More information about the FT-IR spectrometer and the main components is given in the following video.
2. Sampling techniques used with FT-IR spectroscopy
FT-IR spectroscopy can be used with a number of sampling techniques and modes of operation. The most widespread of them are
- Transmission spectroscopy (samples are solutions of KBr pellets)
- Attenuated Total Reflection(ATR, samples without any treatment can be used)
- Specular reflectance and diffuse reflectance spectroscopy (DRIFTS)
Also gas chromatography/FT-IR spectroscopy (GC/FT-IR), thermogravimetry/FT-IR spectroscopy (TG/FT-IR) have been used. In recent years FT-IR microspectroscopy (also called FT-IR microscopy) has gained popularity due to the opportunity to analyse very small samples by using different sampling techniques (ATR, reflectance, transmission), including the mapping and imaging approaches. The greatest advances with FT-IR microspectroscopy have been made by using synchrotron (SR) radiation to enhance signal-to-noise ratio and spatial resolution of FT-IR (SR-µFTIR).
Each of these techniques has its advantages and disadvantages. The technique selected depends on such factors as the information required, the nature of the material being analysed, also the size of the sample. Below we look more closely at ATR and reflectance FT-IR spectroscopy, as well as at FT-IR microspectroscopy.
2.1. General aspects of ATR-FT-IR spectroscopy
Attenuated total reflection (ATR) has been developed since 1959 and is now probably the most common sampling technique in FT-IR spectroscopy [6]. ATR enables qualitative and quantitative analysis of samples with little or no sample preparation. In principle, it is a non-destructive technique. ATR is easily miniaturized so that high-quality spectra can be scanned of samples with a diameter far less than a millimetre.
In this technique, the sample is placed in contact with the internal reflection element (IRE), also called ATR crystal, and IR radiation from the source is directed through the IRE to its surface that is in contact with the sample at a certain angle (θ) so that the light is totally reflected (see Fig. 2) [3]. In order to observe total internal reflection, the angle of the incident radiation θ must exceed the critical angle θc. This angle is a function of the refractive indices of both the sample and the ATR crystal. The critical angle is defined as [4]:

where, n1 is the refractive index of the ATR crystal and n2 is the refractive index of the sample.
Importantly, the refractive index of the crystal must be higher than that of the sample in order for the total reflection can occur. Therefore, high refractive index materials are chosen for the ATR crystal. The hardness of the material is also an important characteristic because in order to obtain good contact with the sample, the sample has to be strongly pressed against the crystal.
The following ATR crystal materials are most commonly used: diamond (very hard, insoluble, inert; wavenumber range: 40 000–200 cm-1; n1=2.4), zinc selenide (a hard and brittle crystal, water-insoluble, slightly soluble in acids; wavenumber range: 10 000–550 cm-1; n1=2.4), germanium (a hard and brittle crystal, chemically inert; wavenumber range: 20 000–600 cm-1; n1=4.0). [3-5]
Upon internal reflection, a part of the IR beam (so-called evanescent wave) penetrates into the sample to a depth of a few micrometers (dp) and is partially (depending on the composition of the sample) absorbed by the sample. The result is a selective attenuation of the radiation at those wavelengths at which the sample absorbs [4,10,11]. So generally, due the interaction of the sample with the penetrating beam, the beam loses energy at those wavelengths where the sample absorbs infrared radiation and thus the infrared spectrum of the sample is obtained.

Only the surface layer of the sample is analysed since the beam penetrates just a few micrometers into the sample [5]. Due to the low depth of penetration, there must be good contact between the sample and the ATR crystal surface.
The depth to which the evanescent wave (or IR radiation) extends into the sample is called the depth of penetration (dp). The depth of penetration (of the evanescent wave) is the distance from the crystal-sample interface where the intensity of the evanescent wave decays to 1/e of its original value. It can be estimated by the following eq [4,12,13]:

dp – depth of penetration
n1 – the refractive index of the ATR crystal
n2 – the refractive index of the sample
λ – the wavelength of the IR radiation
θ – angle of incidence of the IR radiation
Changes in the angle of incidence of the infrared radiation have an effect on the depth of penetration and thus the ATR spectrum of the sample. In most devices it is not possible to vary the angle continuously, usually 30°, 45° and 60° are employed [14]. The angle of incidence must be chosen to exceed the critical angle in order to have internal reflection and produce an ATR spectrum.
ATR-IR and transmission spectra are similar, but not identical [11,13]. The depth of penetration (and thus the effective path length) is dependent on the wavelength and refractive index of the sample (which in turn depends on wavelength, see below). The depth of penetration is proportional to wavelength, and therefore, an increase in depth of penetration is observed at higher wavelengths (lower wavenumbers). This leads to the increase of the intensity of the bands at low wavenumbers relative to high wavenumbers and is one of the causes of differences between the ATR-IR spectra and transmission IR spectra. [4,5]
The refractive index also affects the depth of penetration of the evanescent wave into the sample. By increasing the refractive index of the ATR crystal, the depth of penetration will decrease. This will decrease the effective pathlength and therefore decrease the absorbance of the spectrum [15]. The refractive index of a material is also a function of wavelength. In the IR spectral region the change of refractive index with wavelength is not monotonous. At certain wavelengths, large nonlinearities are observed. [4,16] Absorption bands that occur near such nonlinearities can be significantly different from those observed in the transmission mode. This is another cause of differences between IR spectra obtained using transmission and ATR modes.
In the following video, main aspects of ATR-FT-IR spectroscopy are shortly explained and examples are given.
Analysis with ATR-FT-IR spectroscopy
In the following video, Dr Signe Vahur demonstrates how to perform analysis of different materials (paint sample, textile piece, paper sheet froma book, pigment powder and liquid varnish) using ATR-FT-IR spectrometer in the Mid-IR and Far-IR region.
2.2. General aspects of specular reflectance and diffuse reflectance infrared Fourier transform spectroscopy (DRIFTS)
The reflectance techniques used in FT-IR can be broadly divided into ATR, Diffuse and Specular reflectance. The ATR technique was discussed above. Below, diffuse and specular reflectance techniques are discussed. In the case of both diffuse and specular reflectance techniques, the radiation interacts directly with the sample surface. The sample type determines how the IR radiation is reflected from the sample surface. It can be reflected similarly as from a mirror, which is known as specular reflection, or scattered in different directions, known as diffuse reflection (see Fig. 3).
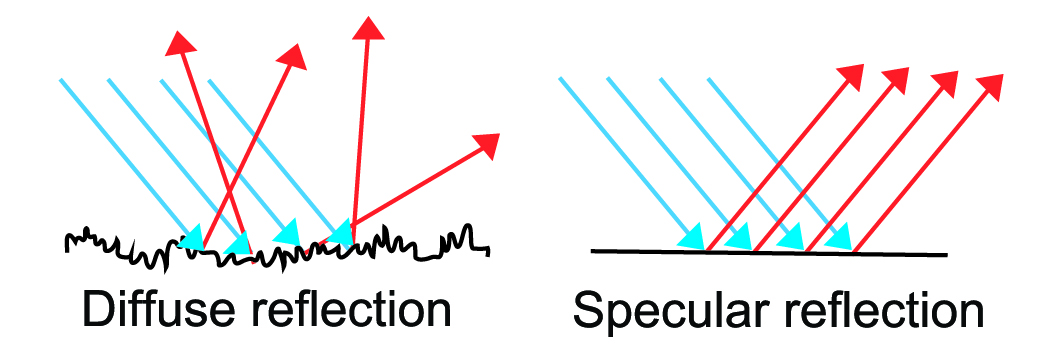
Diffuse reflectance is commonly known as DRIFTS (Diffuse reflectance infrared Fourier transform spectroscopy). As shown in Fig. 3 diffuse reflectance is produced by rough surfaces. The radiation is diffusely reflected, i.e. it can go in many directions from the surface. Before being reflected, the IR radiation penetrates into the sample to a depth (typically few micrometers), which is dependent on the reflective and absorptive properties of the analysed sample. The sample partially absorbs the radiation (depending on the molecular structure). The partially weakened radiation is then diffusely re-emitted from the sample and collected on a mirror that focuses energy coming from the sample onto the detector.
DRIFTS is typically used for measuring IR spectra from uneven (rough) surfaces or from powders. In the latter case, a small amount of sample can be added into a special sample cup on a sliding metal strip. When using powdery solids, strongly absorbing sample might require dilution in a non-absorbing IR-transparent matrix (for example KBr). Preparation of samples is not always necessary: from powders, soils, textile fibres, printed papers, etc. spectra can be measured also directly [17]. Spectra recorded in DRIFTS mode are somewhat similar to spectra acquired with transmission mode, however they differ from transmission spectra by the intensity ratios of the peaks.
Specular reflectance is defined as light reflected from a smooth surface (such as a mirror, coated metal surface, etc.) at a definite angle (see Fig. 3.) Specular reflectance occurs only when the reflected angle of radiation equals the angle of incidence. The amount of reflected light depends upon the angle of incidence of the external light radiation source, the refractive index, surface roughness and absorption properties of the sample [18]. Specular reflectance is typically used to measure coating thicknesses etc. on smooth reflective surfaces.
For the measurement of specular reflection, the sample is usually placed on a highly reflective plate, e.g. polished gold or mirror. For obtaining good reflectance spectrum, it is important that the surface is as smooth as possible and the radiation beam is as focused as possible on the selected analysis area of the sample. Also, when recording spectra in reflection mode there are significant losses of energy during the measurement and the best possible detector sensitivity is needed so that the obtained spectra are not noisy.
Specular reflectance spectra are different from the spectra acquired with transmission or ATR mode. Specular reflectance spectra can be converted to roughly match spectra obtained in the transmission mode using the Kramers-Kronig transformation. It is a mathematical transformation that can be applied to any specular reflectance spectrum to eliminate the effect of variations in the refractive index of the sample and to obtain more interpretable spectra. However, we recommend that for the interpretation, it is reasonable to compare the reflectance spectrum of the sample to a reference spectrum of the pure material also obtained in the reflectance mode.
2.3. General aspects of FT-IR microspectroscopy
FT-IR microspectroscopy (also called FT-IR microscopy) enables to analyse very small samples with very high locality – with spot sizes down to few micrometers in diameter. An important additional possibility of this technique is mapping function that allows doing mapping in selected areas of the sample on the basis of their spectral features.
In the FT-IR microspectroscopy systems, an optical microscope can be coupled to an FT-IR spectrometer or these can be together in the same equipment. Infrared microscopes use reflecting optics such as Cassegrain objectives (these are used in conventional optical microscopes) [17]. With FT-IR microspectroscopy different sampling techniques like transmission, reflectance and ATR modes can be used.
In the following video the main aspects of FT-IR microspectroscopy are discussed and transmission, reflectance and ATR modes and their capabilities are compared.
Analysis with FT-IR microspectroscopy
In the following video, Dr Signe Vahur demonstrates how to analyse samples (cross-section of the paint sample, paper sheet with ink, painted wallpaper) using FT-IR microspectrometer in the ATR and reflectance modes.
3. Interpretation of IR spectra of different materials
Identification of the composition of the studied material is often based on the comparison of its IR spectrum with a spectral library of reference materials. Many papers [13,16,19-23] and books [2,4,5,8,24-26] have been published from where IR spectra are available.
Our cultural heritage work group has also created an online database [19] with more than 150 cultural heritage-, art- and conservation-related ATR-FT-IR spectra measured in the extended region of 4000-80 cm–1 (mid-IR and far-IR region). The database is freely available here: https://spectra.chem.ut.ee/. This spectral collection has over 200 daily visits on working days. Also, another highly valuable online database has been made available by the Infrared & Raman Users Group (IRUG) – http://irug.org/ – from where different IR (and also Raman) spectra of cultural heritage materials can be obtained free of charge.
- Perez-Alonso, M.; Castro, K.; Madariaga, J. Vibrational Spectroscopic Techniques for the Analysis of Artefacts with Historical, Artistic and Archaeological Value. Curr. Anal. Chem. 2006, 2 (1), 89–100. https://doi.org/10.2174/157341106775197385.
- Smith, B. C. Infrared Spectral Interpretation: A Systematic Approach; CRC Press: Boca Raton etc., 1999.
- Willard, H. H.; Merritt, Jr., L. L.; Dean, J. A.; Settle, Jr., F. A. Instrumental Methods of Analysis; Wadsworth Publishing Company: Belmont, 1988.
- Vahur, S. Expanding the Possibilities of ATR-FT-IR Spectroscopy in Determination of Inorganic Pigments. PhD thesis, University of Tartu, Tartu, Estonia, 2010.
- Derrick, M. R.; Stulik, D.; Landry, J. M. Infrared Spectroscopy in Conservation Science; Scientific tools for conservation; Getty Conservation Institute: Los Angeles, 1999.
- Ullmann’s Encyclopedia of Industrial Chemistry. Vol. B 5, Analytical Methods 1, 5., completely rev. ed.; Günzler, H., Ed.; VCH Verlagsgesellschaft: Weinheim, 1994.
- Forensic Examination of Glass and Paint: Analysis and Interpretation; Caddy, B., Ed.; Taylor & Francis: London, 2001.
- Kemp, W. Organic Spectroscopy, 3rd ed.; Macmillan Press LTD: Basingstoke ; London, 1992.
- Skoog, D. A.; West, D. M.; Holler, F. J.; Crouch, S. R. Skoog and West’s Fundamentals of Analytical Chemistry, 9th edition, Cengage technology edition.; Cengage Learning: Hampshire, 2014.
- van der Weerd, J. Microspectroscopic Analysis of Traditional Oil Paint. Ph.D. thesis, University of Amsterdam, AMOLF, Amsterdam, 2002.
- Harvey, D. Modern Analytical Chemistry; McGraw-Hill: Boston, 2000.
- Averett, L. A.; Griffiths, P. R.; Nishikida, K. Effective Path Length in Attenuated Total Reflection Spectroscopy. Anal. Chem. 2008, 80 (8), 3045–3049. https://doi.org/10.1021/ac7025892.
- Vahur, S.; Knuutinen, U.; Leito, I. ATR-FT-IR Spectroscopy in the Region of 500–230 cm−1 for Identification of Inorganic Red Pigments. Spectrochim. Acta. A. Mol. Biomol. Spectrosc. 2009, 73 (4), 764–771. https://doi.org/10.1016/j.saa.2009.03.027.
- Surface Analysis Methods in Materials Science; O’Connor, D. J., Sexton, B. A., Smart, R. St. C., Eds.; Springer Science & Business Media, 2003.
- Introduction to Attenuated Total Reflection (ATR) Spectroscopy; Thermo Fisher Scientific, 1998.
- Kendix, E. L.; Prati, S.; Joseph, E.; Sciutto, G.; Mazzeo, R. ATR and Transmission Analysis of Pigments by Means of Far Infrared Spectroscopy. Anal. Bioanal. Chem. 2009, 394 (4), 1023–1032. https://doi.org/10.1007/s00216-009-2691-2.
- Handbook of Analytical Techniques; Günzler, H., Williams, A., Eds.; Wiley-VCH: Weinheim ; New York, 2001.
- Stuart, B. Infrared Spectroscopy: Fundamentals and Applications; Analytical techniques in the sciences; J. Wiley: Chichester, West Sussex, England ; Hoboken, NJ, 2004.
- Vahur, S.; Teearu, A.; Peets, P.; Joosu, L.; Leito, I. ATR-FT-IR Spectral Collection of Conservation Materials in the Extended Region of 4000-80 cm–1. Anal. Bioanal. Chem. 2016, 408 (13), 3373–3379.
- Castro, K.; Pérez, M.; Rodríguez-Laso, M. D.; Madariaga, J. M. Peer Reviewed: FTIR Spectra Database of Inorganic Art Materials. Anal. Chem. 2003, 75 (9), 214 A-221 A. https://doi.org/10.1021/ac031320e.
- Peets, P.; Leito, I.; Pelt, J.; Vahur, S. Identification and classification of textile fibres using ATR-FT-IR spectroscopy with chemometric methods. Spectrochim. Acta. A. Mol. Biomol. Spectrosc. 2017, 173, 175−181.
- Peets, P.; Kaupmees, K.; Vahur, S.; Leito, I. Reflectance FT-IR spectroscopy as a viable option for textile fiber identification. Herit. Sci. 2019, 7 (1), 93.
- Madejová J, Komadel P. Baseline Studies of the Clay Minerals Society Source Clays: Infrared Methods. Clays and Clay Minerals. 2001;49:410–32.
- Smith, B. C. Fundamentals of Fourier Transform Infrared Spectroscopy, 2nd ed.; CRC Press: Boca Raton, FL, 2011.
- Modern Analytical Methods in Art and Archeology; Ciliberto, E., Spoto, G., Eds.; Wiley: New York, 2000.
- Larkin, P. J. Infrared and Raman Spectroscopy: Principles and Spectral Interpretation; Elsevier: Amsterdam [etc.], 2011.
The slides used in the videos can be downloaded from here: