MOOC: Instrumental analysis of cultural heritage objects
5.1. Chromatography
Chromatography is one of the most powerful techniques in analytical chemistry, which is widely used for the analysis of different cultural heritage materials. In this course, only the most general theoretical aspects of chromatography will be presented.
Chromatography is a technique to separate individual components (typically organic compounds) of a mixture based on their distribution or adsorption characteristics. The separation is achieved in a two-phase system: the mobile and stationary phase. The mobile phase flows through the stationary phase and carries components of the mixture with it. The components can move between the phases – from the mobile phase to the stationary phase and back to the mobile phase. The compounds that reside preferably in the mobile phase elute from the chromatographic system earlier and compounds that stay preferably in the stationary phase elute later. Chromatographic separation depends on different properties of the compounds, e.g. polarity (liquid and gas chromatography), boiling point (gas chromatography) and ionic charge (liquid chromatography). [1]
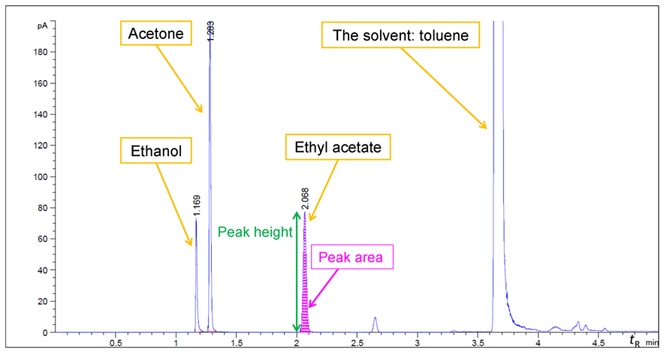
In an analytical chromatographic system, the separated compounds are detected and represented as peaks on a chromatogram. A chromatogram starts (time = 0 min) at the moment when the sample is introduced into the chromatographic system and lasts until all the compounds are assumed to be eluted from the system. Each peak in a chromatogram is characterised by its retention time (tR), peak height and peak area (see Fig.1). Retention time is the time it takes for a compound to pass through the system under the set chromatographic conditions.
In chromatography, identification (qualitative analysis) of compounds is done based on (1) retention time and possibly (2) additional information given by the detector (see below). For the quantitative analysis, the area (or sometimes height) of the peak is used – the higher it is, the higher the compound’s content in the sample. For qualitative as well as quantitative analysis, the analysis of standard compounds is usually required. A standard compound (aka a standard substance, standard material, or a chemical standard) is the same compound as the analyte and is often obtained from a supplier with a known concentration and purity. [1]
In the following video the general aspects of chromatography are explained.
A short overview of gas and liquid chromatography is given below.
1. Gas chromatography (GC)
Gas chromatography (GC) is considered to be the most efficient, sensitive and reliable method for the analysis of mixtures volatile compounds. GC is a type of chromatography where the mobile phase is a gas (mainly He, N2 or H2). As the mobile phase carries the components through the stationary phase, it is also called the carrier gas. GC enables the qualitative and quantitative analysis of compounds that are volatile, i.e. have boiling points below 500°C and are thermally stable. The separation in the GC system is mostly based on the difference in boiling points of the components. However, the components’ chemical affinity for the stationary phase is also an important factor. [2,3]
The sample can be introduced as liquid or gas into the GC. A solid or liquid sample can be dissolved in a solvent, such as diethyl ether, toluene, dichloromethane, etc. Water is usually not suitable as it can damage the column. It is also possible to directly inject and analyse gases or the vapour phase above the sample (headspace method). In the headspace method, a liquid or a solid containing the volatile analyte(s) is kept in a closed system (e.g. a vial) until an equilibrium between the two phases (gas vs liquid or gas vs solid) is established. Then the vapour phase is analysed by injecting it into the GC system. [2]
Only about 10‒20% of common organic compounds can be analysed by GC (boiling point below 500°C). Some less volatile compounds, can be made more volatile by derivatisation (e.g., methylation, silylation). Derivatisation (CLICK HERE to read more about it) is a process where a compound is chemically modified before the analysis. Derivatisation makes it possible to analyse many compounds that would otherwise not be GC amendable. Sometimes derivatisation is used to improve the chromatographic separation. Some examples of compounds requiring derivatisation include oils, polymers, sterols, waxes, and drugs. [2,4]
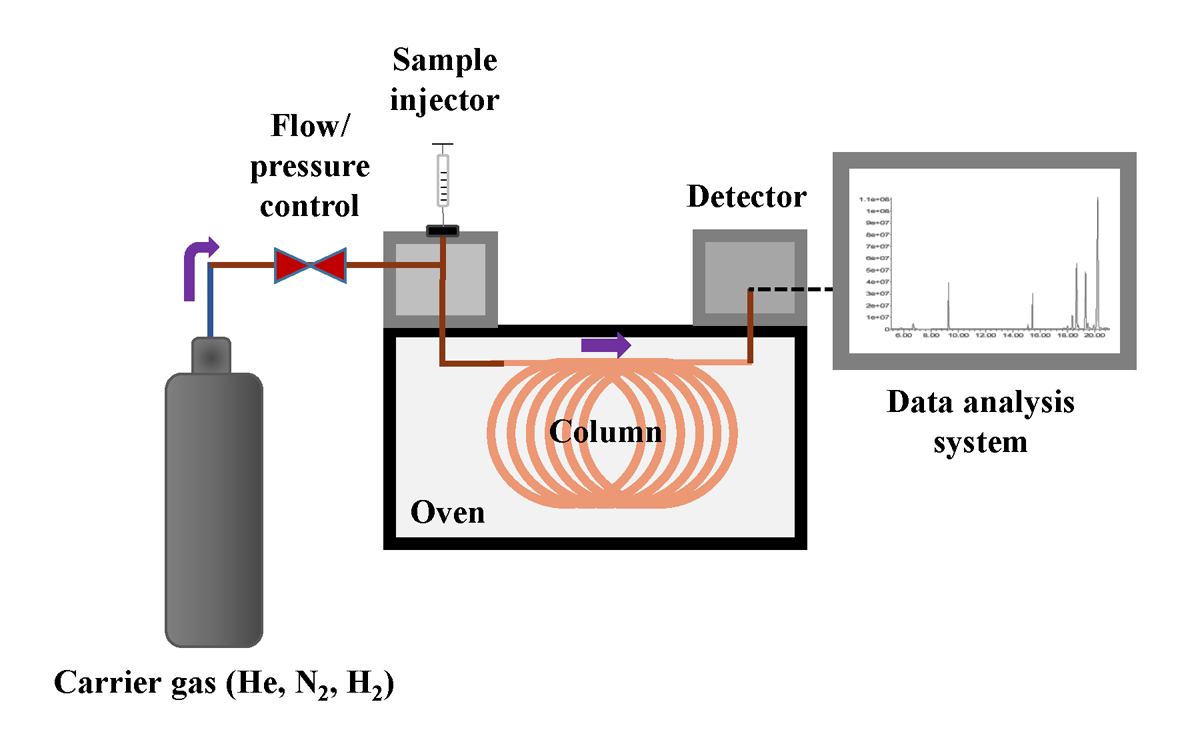
The overall scheme for GC system is presented in Fig. 2. For the analysis with GC, the sample (typically as a solution) is injected with a micro syringe manually or by the autosampler into the sample inlet. The inlet is a heated chamber where the compounds in the sample are evaporated and directed into a continuous flow of carrier gas. The carrier gas (mobile phase), together with the gaseous sample, is directed through the column (the tube which holds the stationary phase), where the chromatographic separation takes place. As explained above, those compounds that spend a smaller fraction of time in the mobile phase have longer retention time (toluene in Fig. 1) and compounds that spend a bigger fraction of time in the mobile phase have shorter retention times (ethanol in Fig. 1). [2,3]
There are two main types of columns – capillary and packed columns (the latter are rarely used and will not be discussed in this course). In a capillary column, the stationary phase is applied as a thin layer on the internal surface of the column. The column itself is a very long (typically 25‒30 m but can be even 100 m) and thin tube (inner diameter of 0.1-0.5 mm) made of fused silica. The stationary phase is a polymeric liquid (mainly polysiloxanes, polyethylene glycols), where functional groups have often been added to vary the polarity of the stationary phase.[2] In cultural heritage, mostly capillary columns are used. For example, a lot of analysis of paint binders (oil and protein-based), waxes, natural resins, etc., are carried out with non-polar columns (for example, colums having a 5% diphenyl-95% dimethyl-polysiloxane stationary phase). [4-6]
The GC column is located in the column thermostat (also known as the oven), which enables accurate temperature control of the chromatographic process. Typically, temperatures in the range of 40 to 300°C are used for GC column. At lower temperatures, the retention times of compounds are longer and at higher temperatures, they are shorter. In most methods, the temperature in the oven is increased during chromatographic analysis (often called the run). The “schedule” of the temperature change is called a temperature program. After the separated compounds exit the column, they are detected in a detector. [2]
The following two main detectors are most often used for GC in the field of cultural heritage:
Mass spectrometric (MS) detector is the most powerful and versatile GC detector. In the case of MS, the separated compounds are ionised (in Electron Ionisation (EI) or Chemical Ionisation (CI) sources, see section 5.2 Mass Spectrometry for more information) and sorted by their mass-to-charge (m/z) ratio. The mass spectrum enables identification of the separated compound by a) searching database of mass spectra or by b) analysing the standard substance of the compound. With the MS detector, it is possible to detect practically all compounds that fit the volatility criteria. The MS detector is also the most used GC detector for the analysis of cultural heritage samples. [5,6]
Flame ionisation detector (FID). In FID, the compounds are burned and ionised in the hydrogen flame. FID detects only compounds, that contain at least one C-H or C-C bond, so it is suitable for the analysis of almost all organic compounds, including components of paint binders, varnishes, etc. FID is robust, highly sensitive and often used for quantitative analysis. For the identification, the standard substance of the compound with the same fixed chromatographic conditions must be analysed and retention times are compared. However, such identification is suitable only for relatively simple samples. [2]
Sample introduction techniques
Two additional sample introduction techniques are widely used in cultural heritage analysis with a GC-MS system to enhance the analysis: pyrolysis (Py-)GC-MS and solid phase microextraction (SPME) GC-MS.
In Py-GC-MS the sample is heated up to 600-1000 °C in a pyrolizer that is connected to the injector port of a GC. This enables the analysis of compounds that do not evaporate under usual GC sample inlet conditions (e.g., polymers). In Py-GC-MS, the sample is decomposed, emitting smaller volatile molecules – pyrolysis products. Their analysis gives information about the initial sample. Py-GC-MS is especially useful for the analysis of various synthetic and/or polymeric materials. [5,6]
SPME is a modified headspace method that is used with GC-MS to enable the analysis of volatile or semi-volatile organic compounds (VOCs and SVOCs, respectively), usually without sample alteration. The SPME is an equilibrium extraction technique based on the partition of the analyte(s) between the vapour phase above the sample and a polymer covered fused silica fibre. After adsorption of sample components on the fibre, the fibre is inserted into the GC inlet, where the analytes are desorbed and directed to the column for separation. SPME GC-MS can provide information about the components of the sample and about their degradation products. [5,6]
Despite different sample introduction methods and derivatisation approaches available, there is still a very large number of compounds that cannot be analysed with a GC. Then liquid chromatography can be of help.
2. Liquid chromatography (LC)
Liquid-chromatography (mostly high-performance liquid chromatography – HPLC or ultra-high-pressure liquid chromatography – UHPLC) is nowadays the most widely used separation technique. The discussion below applies to both HPLC as well as UHPLC. The simplified overall scheme of a HPLC is presented in Fig. 3.
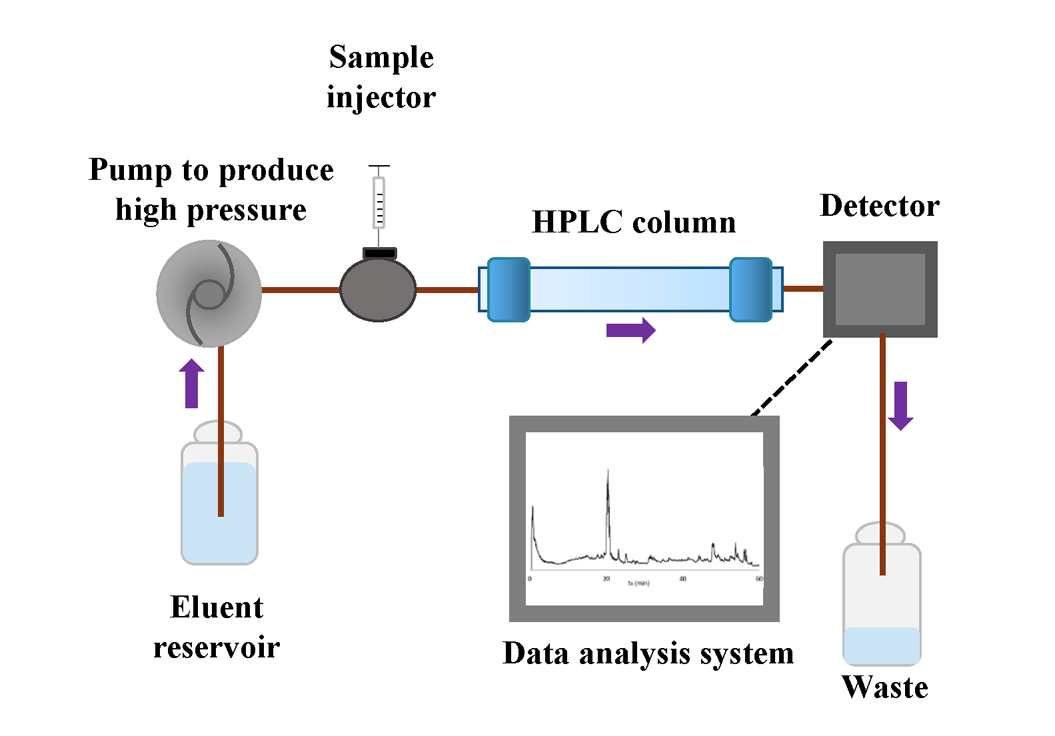
The logic of LC is similar to GC – the compounds are carried through a stationary phase and separated according to their different properties. In LC, the mobile phase is a liquid – eluent – that is pumped through the stationary phase. Compared to GC, LC depends on more different interactions: a) compound vs eluent; b) compound vs stationary phase; c) mobile phase vs stationary phase and d) mutual interaction of the mobile phase molecules. Optimisation of different parameters, like mobile phase composition and pH, stationary phase type, eluent additives, etc. is very important for achieving good separation in LC and the suitable set of parameters depends on the type of material to be analysed. [1]
One of the key aspects of LC analysis is the optimisation of the mobile phase composition. This includes the selection of solvents and pH (buffers) and their concentration. The buffer solution is a solution that helps to keep the pH of the mobile phase constant. This is important if the analysed compounds have acidic or basic properties. If this is the case, then varying the buffer pH allows to change the polarity of the compounds and thereby their retention time and separation from each other. [7]
In simpler cases, LC separation is carried out isocratically – eluent composition does not change during the analysis. Nowadays, most LC instruments allow gradient elution. In this case, eluent composition changes during the chromatographic run. This approach help to improve the separation of components with similar properties and reduce the analysis time of compounds with very different properties. [7]
Other parameters that can be chosen are, for example, the stationary phase type particle diameter, the diameter and length of the column, the flow-rate of the eluent, etc.
After the separation in the column, the compounds are directed into the detector. Many different types of detectors can be used with LC depending on the properties of the components and information that is needed. Some of the most used detectors for LC are UV-Vis/PDA, fluorescence, and mass-spectrometric detectors.
Detectors for LC
- UV-Vis/PDA detector is probably the most common LC detector. A photodiode array detector (PDA) enables recording of the whole UV-Vis absorption spectrum from each chromatographic peak and thereby provides some information for component identification. For compound identification, standard material chromatograms obtained under the same conditions are needed. This detector typically embraces both the visible range (400-780 nm) – useful for detecting coloured compounds – and the UV range (190-400 nm) – useful for detecting compounds containing double bonds (C=C), nitro groups (-NO2), halogens (-Br, -I) etc. UV-Vis/PDA is not suitable for detecting compounds containing only single bonds and no heavy atoms, such as simple alcohols, ethers, etc. It is also not suitable for trace analysis: only compounds with considerable concentration can be detected. In conservation, LC-UV-Vis is used to analyse dyes, lipids, binders, polysaccharides, etc. [6,8]
- Mass spectrometer (MS) as a detector is the most powerful detector available in LC. Mass spectrometry is a very sensitive technique (very low concentrations can be detected) and enables identifying compounds according to the mass-to-charge ratio (m/z) of the ion corresponding to the analysed molecule, as well as the m/z ratios of fragments formed from it. Mass spectrometry is more thoroughly explained in section 5.2. Mass Spectrometry. [6,8]
Fluorescence detector (FLD) is suitable for detecting fluorescent compounds. Fluorescence is not a universal phenomenon: most compounds do not fluoresce. But fluorescence is observed for many dyes and some pigments, as well as polycyclic aromatic hydrocarbons (PAHs) that can be found in bitumen, tars. Thus, fluorescence is a characteristic property of limited number of materials and makes their identification easier. The sensitivity of the detector varies widely, depending on the detected compound(s). For compounds with intense fluorescence (e.g. the ones mentioned above), the sensitivity can be quite high. FLD has specific niche applications and is much less used than UV-Vis/PDA. [6,8]
Types of LC
There are different possibilities for how to separate compounds in LC: by their polarity (reverse phase and normal phase chromatography), size (size exclusion chromatography) and ion-ion interaction (ion chromatography). Each of these is a separate technique in the domain of LC. These techniques are compared in Table 1.
Table 1. Comparison of liquid chromatographic techniques [6,7].
| Type of LC | Basic principle | Analysed compounds | Mobile phases (eluent) | Stationary phases |
|---|---|---|---|---|
| Reversed Phase (RP) | The stationary phase is less polar than mobile phase → polar compounds are less retained (short retention time). | Moderately polar (dyes or protein-based binders like animal glue, egg, casein) to polar compounds (resins, etc.) | Polar solvent mixtures (water, methanol, acetonitrile, etc.) | Silica gel particles modified with octadecyl (C18) or octyl (C8) groups, etc. |
| Normal Phase (NP) | The stationary phase is more polar than the mobile phase → polar compounds are more retained (long retention time). | Rather non-polar (lipids, waxes, tars) | Non-polar solvent mixtures (hexane, ethyl acetate, toluene, acetone, dichloromethane, etc.) | Silica gel (bare) or modified with polar groups. |
| Size exclusion chromatography (SEC) | Separation is based on the size of the analyte. Bigger molecules have shorter retention times. | Proteins, water-soluble polymers, oligo- and polysaccharides, etc. | Solvent mixtures (tetrahydrofuran, chloroform, water, etc.) | Silica gel or polymeric material with different pore sizes. |
| Ion chromatography | Compounds are separated due to the ion exchange process with the stationary phase. Analytes with higher charge have longer retention times. | Ionisable compounds, such as proteins, amino acids, etc. | Aqueous buffers | Polymer beads (styrene-divinylbenzene copolymer) modified with ionic functional groups (carboxylic acid, diethylaminopropyl, etc.) |
- Heftmann, E. Chromatography. Fundamentals and applications of chromatography and related differential migration methods – Part A: Fundamentals and techniques, 6th ed.; Elsevier B. V.: Amsterdam, the Netherlands, 2004.
- Hübschmann, H.-J. Handbook of GC/MS: Fundamentals and Applications, 2nd, Completely Revised and Updated Edition; WILEY-VCH Verlag GmbH & Co. KGaA: Weinheim, Germany, 2009.
- McNair, H., M.; Miller, J. M. Basic Gas Chromatography, 2nd ed.; John Wiley & Sons, Inc.: Hoboken, NJ, USA, 2009.
- Tammekivi, E. Derivatization and Quantitative Gas-Chromatographic Analysis of Oils, PhD thesis; University of Tartu Press: Tartu, Estonia, 2021.
- Colombini, M. P.; Modugno, F. Organic Mass Spectrometry in Art and Archaeology; John Wiley & Sons, Ltd.: Chichester, UK, 2009.
- Mazzeo, R. Analytical Chemistry for Cultural Heritage; Springer International Publishing: Switzerland, 2016.
- Niessen, W., M., A. Liquid Chromatography-Mass Spectrometry, 3rd ed.; CRC Press: USA, 2006.
- Peets, P. Development of Instrumental Methods for the Analysis of Textile Fibres and Dyes, PhD thesis; University of Tartu Press: Tartu, Estonia, 2020.
The slides used in the video can be downloaded from here: