MOOC: Instrumental analysis of cultural heritage objects
3.2. Raman spectroscopy
In this course the general introduction to Raman spectroscopy and microscopy will be provided and practical tips as well as examples will be given. The capability of Raman spectroscopy for the analysis of real-life samples (paint components, clays, coating materials, etc.) taken from historical and archaeological objects will be discussed.
1. Principles of Raman spectroscopy
Raman spectroscopy is widely used in the investigation of cultural heritage materials due to its high spatial resolution (typically in the range of 1 to 10 µm), large amount of obtainable information, in many cases possibility to be used non-destructively and ability to perform in-situ analysis [1,2]. With Raman spectroscopy it’s possible to analyse various materials: minerals, inorganic and organic pigments, binding media, varnishes, ceramics, plastics, textile fibres etc. [2]
The following video explains the principles and instrumentation of Raman spectroscopy.
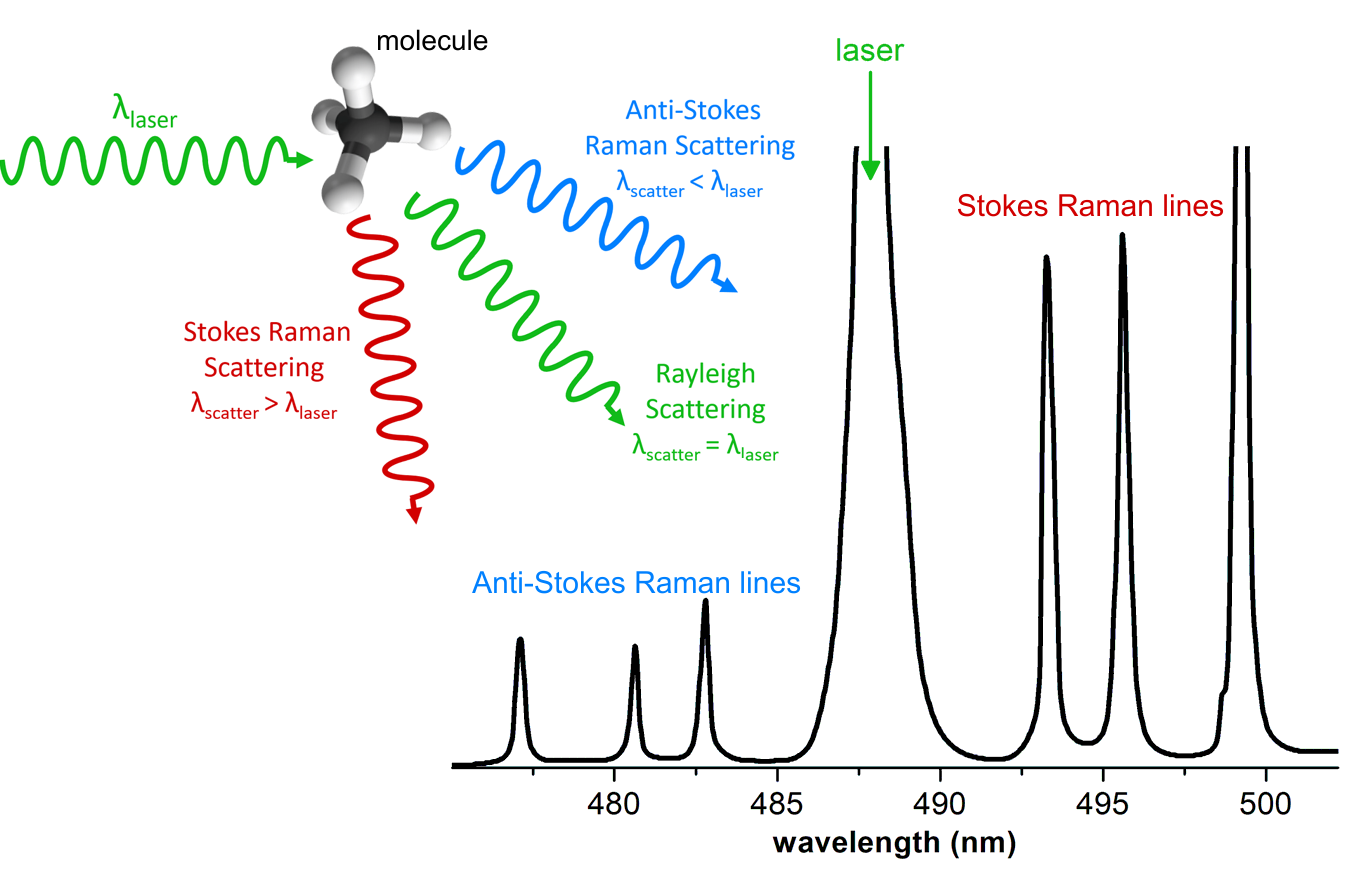
Similarly to infrared spectroscopy, Raman spectroscopy is classified as vibrational spectroscopy [3]. Raman spectroscopy is based on Raman scattering (or Raman effect) that reveals the vibrational, rotational and other low-frequency modes of molecules [4]. In this technique, the sample is exposed to an intense beam of monochromatic light (typically a laser beam) in the frequency range of visible, near-infrared or near-ultraviolet regions [5]. The electromagnetic radiation, interacting with a substance can be transmitted, absorbed, or scattered [6]. When the monochromatic radiation is scattered by molecules, the majority of the radiation undergoes the common Rayleigh scattering (radiation’s frequency/wavelength remains unchanged). However, a small fraction of the scattered radiation is observed to have a slightly different frequency from that of the incident radiation. This is known as the Raman scattering [7]. The Raman lines show up pairwise. The dominant Stokes lines have a lower frequency (longer wavelength) than the initial radiation, whereas the weaker (often undetectable) anti-Stokes lines have a higher frequency (shorter wavelength) [4,5]. The frequency shifts are virtually independent of the excitation wavelength and are characteristic of the particular substance/molecule. Usually, one only records the relatively strong Stokes lines, which therefore are attributed a positive frequency shift. Such frequency shift is called the Raman shift, is measured in wavenumbers (in cm-1) ) and plotted on the X axis of the Raman spectrum [4]. See the scheme in Fig. 1.

In Raman spectroscopy, as it is a scattering technique, samples are simply placed in the laser beam and the scattered radiation is collected and analysed [8]. Raman spectrometer measures the wavelength-dependent intensity of the inelastically scattered light.
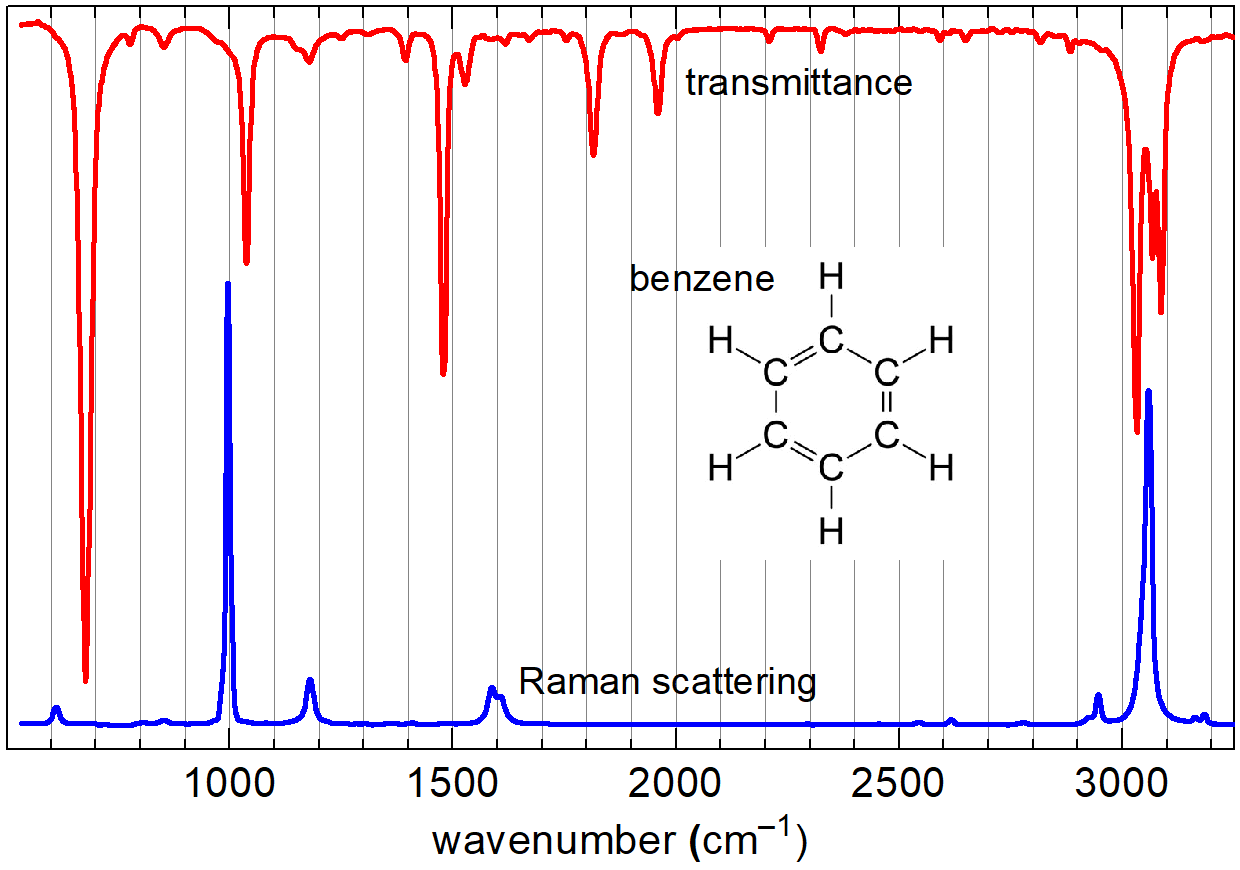
The obtained Raman spectra are essentially vibrational spectra. Hence, if presented in the Raman shift scale, they are directly comparable to corresponding infrared absorption spectra (see Fig. 2). I.e. The signals in the IR and Raman spectra are due to the same vibrations in molecules and are therefore located at the same wavenumbers in both spectra. However, the Raman spectrum arises in a different manner and the rules, which vibrations are Raman-active (and thus produce signals in the spectrum), as well as what governs the intensity of the signals, are different. It turns out that a vibration is Raman-active (i.e. revealed as a spectral line in the Raman spectrum), if the polarizability of the molecule changes during the vibration [7]. It often happens that vibrations that are active (or give high-intensity signals) in Raman scattering are inactive (or give low-intensity signals) in the infrared, and vice versa [7]. Therefore, Raman spectra often provide complementary information to IR spectra. Some examples:
- C=O bond is highly polar, but polarizability change upon vibration is small, so the Raman signal is weak.
- C-H bonds display modest change in polarizability upon vibration, but because in typical organic molecules there are lots of C-H bonds, the signals corresponding to their stretching vibrations are often among the strong in the Raman spectrum.
- C-C and especially C=C bonds undergo strong polarizability change upon vibration. As a result, both are typically visible in the Raman spectrum, although C-C vibrations, in many cases, have very limited diagnostic value. At the same time C=C, bond vibrations are well distinguishable and often lead to some of the strongest signals in the Raman spectrum.
Compare these examples to the ones involving the same bonds in section 3.1. IR Spectroscopy.

1.1. Instrumentation
There are two types of Raman spectrometers: dispersive spectrometers (based on the use of diffraction grating) and interferometer containing Fourier-transform Raman spectrometers (FT-Raman) [9].
In general, the main components of Raman spectrometers are presented in the following scheme:

Although the positions of the signals in the Raman spectrum essentially do not depend on the excitation wavelength and intensity, their choice is nevertheless very important. Different excitation wavelengths are suitable for the analysis of different types of material. The wavelength will affect the Raman intensity, spatial resolution, background fluorescence, and potential damage to the sample. Fluorescence is a particular nuisance for Raman spectroscopy. Although the majority of molecules do not fluoresce, fluorescence signal intensities are orders of magnitude higher than Raman intensities, so that even traces of fluorescent compounds (e.g. various dyes) in the sample can seriously interfere with Raman spectra (see section 1.2 below).
Lasers almost exclusively are used as excitation sources because they are highly monochromatic, give high-intensity radiation and can be efficiently focused due to their high coherence. Only continuous wave (CW) lasers are used, as pulsed lasers easily damage the sample. Some popular CW lasers are presented in Table 1. Traditionally, laser wavelengths up to 830 nm are used in dispersive instruments, while the 1064 nm laser line is typically employed in FT-Raman setups. With the availability of sensitive InGaAs array detectors, it has become meaningful to use also the 1064 nm lasers with dispersive Raman instruments.
Table 1. Laser sources for Raman spectroscopy.
| Laser Type | Available wavelengths (nm) |
|---|---|
| Argon ion (Ar+) | 364, 457, 488, 514.5 (VIS) |
| Nd3+:YAG or Nd3+:YVO4 | 1064 (Near-IR) or 532 (frequency-doubled) (VIS) |
| He-Ne | 632.8 (VIS) |
| Laser diodes | 785 or 830 (Near-IR) |
Raman scattering efficiency decreases with increasing excitation wavelength proportionally to λ4, i.e. when wavelength increases two times Raman signal intensity decreases 16 times. However, short-wavelength exiting radiation more easily induces fluorescence, absorbs more strongly in the sample or causes other undesirable effects due to higher photon energy. Hence, the most common laser wavelengths in Raman spectroscopy are in the visible and NIR region (such as 633 or 785 nm), which have the advantage of low fluorescence whilst retaining relatively high Raman intensity. For samples which exhibit fluorescence even under red excitation (for example, dyes), the 1064 nm laser may be needed. Near-infrared lasers have smaller photon energy compared to visible lasers and are therefore unable to excite fluorescence. At the same time, they are usually more powerful in order to compensate for the reduced Raman scattering efficiency. Therefore, they may damage the sample by strongly heating it. This is especially problematic for strongly absorbing (black) samples, in which case the UV/visible lasers (operating at lower intensities) may be more suitable.
Dispersive Raman spectrometers
A dispersive spectrometer utilizes a diffraction grating to angularly disperse the light. As a result, at the detector plane, different wavelengths become spatially separated. Nevertheless, prior to entering the spectrometer, the incoming light should go through a special edge or notch filter to suppress the primary (Raman-scattered) light and thereby reduce the scattering inside the spectrometer. A matrix detector is used to record the dispersed spectrum. Typically, a silicon-based cooled CCD is used, which is very sensitive in the visible and NIR region (up to 1100 nm).
FT-Raman spectrometers
Commercial FT-Raman spectrometers were introduced in the late 1980s [10]. Their operating principle is similar to that of FTIR spectrometers and is based on an interferometer. As the Raman-scattered light enters the instrument, the interferometer selectively modulates the individual spectral components by systematically changing an optical path length difference. The resulting beam of light is recorded by a point detector. FT-Raman is superior to a dispersive instrument if the excitation wavelength is in the near-IR region beyond 1000 nm. Commonly, the 1064 nm laser excitation along with germanium or indium gallium arsenide (InGaAs) detector is used. They also offer excellent wavelength accuracy and can potentially combine IR absorption and Raman measurement capacity in single instrument. However, FT-Raman frequently needs to use high laser intensities due to the reduced Raman scattering efficiency at longer wavelengths, which may damage the sample by heating.
Instrument types and special techniques of Raman Spectroscopy
A variety of Raman instruments and special techniques are used for the analysis of cultural heritage materials. The choice of the instrument determines the sensitivity, spectral range and resolution, spatial resolution, availability of different excitation sources, and convenience of operation.
- Micro-Raman spectrometer (or Raman microscope) is the most common bench-top Raman instrument. A high-resolution spectrometer (either dispersive or FT) and one or several laser sources are coupled through an optical microscope. The excitation beam is focused and the secondary emission is collected simultaneously by the microscope objective in backscattering geometry. A high-numerical aperture (NA) objective yields both a high spatial resolution and a high collection efficiency.
- Surface-enhanced Raman spectroscopy (SERS) involves inelastic light scattering by molecules placed close to nanometal surfaces, which amplify the scattering by plasmonic resonance. One approach is to study molecules adsorbed onto metal – first of all, silver or gold – nanoparticles [11]. Another approach is to stimulate the molecules by a sharp metal tip. Such tip-enhanced Raman spectroscopy is typically implemented by combining a confocal microscope and a scanning probe microscope.
- In Resonance Raman spectroscopy (RRS) the incident photon energy is close in energy to an electronic transition of a compound or material under examination.
In a portable Raman spectrometer, a miniature dispersive spectrometer and a small laser source are integrated into a portable, hand-held device. Hence, the instrument can be used to perform in situ analysis in museums, archives, also outdoors on archaeological sites for the analysis of mural or cave paintings. Such portable devices frequently employ fiber-optic probes.
1.2. Issues with Raman spectroscopy
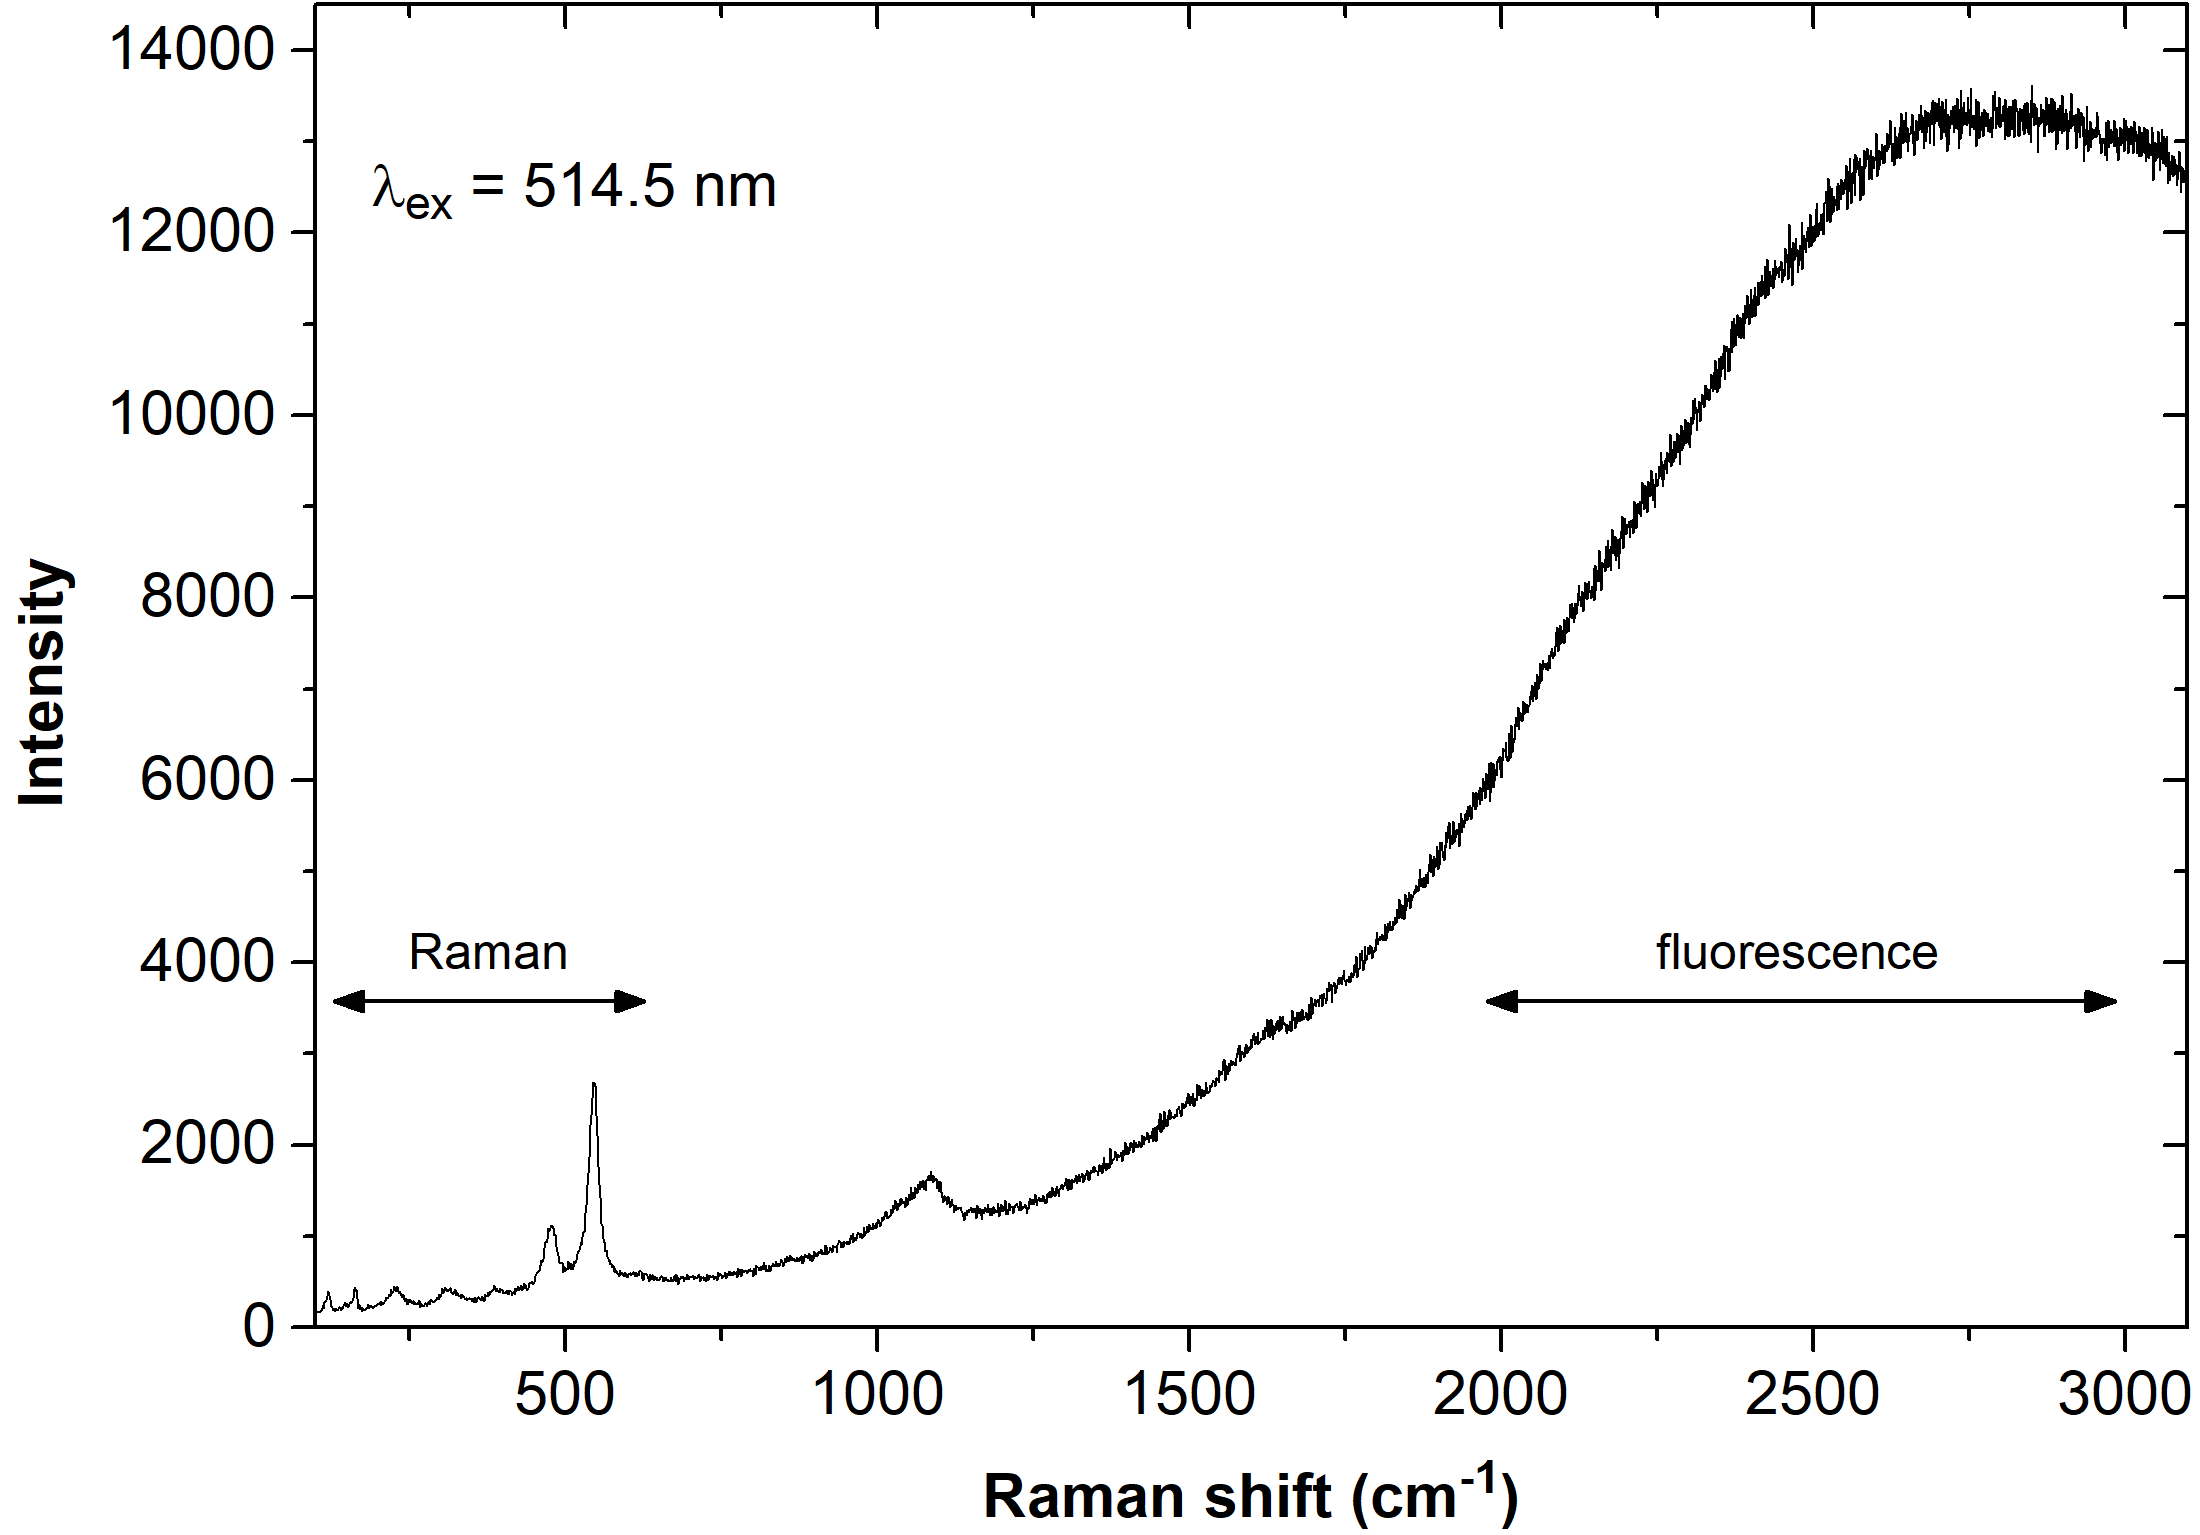
Compared to IR absorption, the primary disadvantage of Raman spectroscopy is the often emerging fluorescent background (see Fig. 3). As Raman scattering is inherently weak, one has to use an intense laser beam for excitation, and for many materials, this results in a strong fluorescence – either due to the material itself or impurities. Sometimes even trace impurities – if they are strongly fluorescent – can lead to disturbing fluorescence background. Fortunately, Raman lines are spectrally close to the laser beam, whereas fluorescence typically has a large Stokes shift.

Relative to the Raman signal, the fluorescent background can be highly intense and even the tail of the fluorescence band may obscure the Raman spectrum. Although the problem can be partially resolved by careful sample preparation, time resolved spectroscopy or coherent anti-Stokes Raman spectroscopy (CARS), there will always be samples that remain problematic to analyse with Raman spectroscopy. [7]
In addition to fluorescence, intense focused laser irradiation can cause heating and degradation of the sample. The problems are typical for organic, soft, photosensitive or dark/coloured materials, whereas transparent inorganic materials usually have a high damage threshold.
2. Analysis with Raman spectroscopy
In the following video, Dr Valter Kiisk demonstrates how to perform measurements with a typical micro-Raman spectrometer.
Identification of the composition of the studied material is often based on the comparison of its Raman spectrum with a spectral library of reference materials [12]. Different papers and books have been published from where Raman spectra or information about excitation wavelengths and a list of wavenumbers in the Raman spectra are available [5,13-15]. Also, a very valuable on-line database has been made available by the Infrared & Raman Users Group (IRUG) – http://irug.org/ – from where different Raman (and also IR) spectra of cultural heritage materials can be obtained free of charge.
- Bitossi, G.; Giorgi, R.; Mauro, M.; Salvadori, B.; Dei, L. Spectroscopic Techniques in Cultural Heritage Conservation: A Survey. Appl. Spectrosc. Rev. 2005, 40 (3), 187–228. https://doi.org/10.1081/ASR-200054370.
- Casadio, F.; Daher, C.; Bellot-Gurlet, L. Raman Spectroscopy of Cultural Heritage Materials: Overview of Applications and New Frontiers in Instrumentation, Sampling Modalities, and Data Processing. Top. Curr. Chem. 2016, 374 (5). https://doi.org/10.1007/s41061-016-0061-z.
- Weerd, J. van der. Microspectroscopic Analysis of Traditional Oil Paint; MolArt; FOM Institute for Atomic and Molecular Physics: Amsterdam, 2002.
- Mukherjee, S.; Ghosh, B. The Science of Clays: Applications in Industry, Engineering and Environment; Springer: Dordrecht, 2013.
- Stuart, B. Analytical Techniques in Materials Conservation; John Wiley & Sons: Chichester, England ; Hoboken, NJ, 2007.
- Modern Analytical Methods in Art and Archeology; Ciliberto, E., Spoto, G., Eds.; Wiley: New York, 2000.
- Willard, H. H.; Merritt, Jr., L. L.; Dean, J. A.; Settle, Jr., F. A. Instrumental Methods of Analysis; Wadsworth Publishing Company: Belmont, 1988.
- Ullmann’s Encyclopedia of Industrial Chemistry. Vol. B 5, Analytical Methods 1, 5., completely rev. ed.; Günzler, H., Ed.; VCH Verlagsgesellschaft: Weinheim, 1994.
- Smith, E.; Dent, G. Modern Raman Spectroscopy: A Practical Approach, Second edition.; Wiley: Hoboken, NJ, 2019.
- Infrared and Raman Spectroscopy in Forensic Science; Chalmers, J. M., Edwards, H. G. M., Hargreaves, M. D., Eds.; Wiley: Chichester, 2012.
- Langer, J.; Jimenez de Aberasturi, D.; Aizpurua, J.; Alvarez-Puebla, R. A.; Auguié, B.; Baumberg, J. J.; Bazan, G. C.; Bell, S. E. J.; Boisen, A.; Brolo, A. G.; Choo, J.; Cialla-May, D.; Deckert, V.; Fabris, L.; Faulds, K.; García de Abajo, F. J.; Goodacre, R.; Graham, D.; Haes, A. J.; Haynes, C. L.; Huck, C.; Itoh, T.; Käll, M.; Kneipp, J.; Kotov, N. A.; Kuang, H.; Le Ru, E. C.; Lee, H. K.; Li, J.-F.; Ling, X. Y.; Maier, S. A.; Mayerhöfer, T.; Moskovits, M.; Murakoshi, K.; Nam, J.-M.; Nie, S.; Ozaki, Y.; Pastoriza-Santos, I.; Perez-Juste, J.; Popp, J.; Pucci, A.; Reich, S.; Ren, B.; Schatz, G. C.; Shegai, T.; Schlücker, S.; Tay, L.-L.; Thomas, K. G.; Tian, Z.-Q.; Van Duyne, R. P.; Vo-Dinh, T.; Wang, Y.; Willets, K. A.; Xu, C.; Xu, H.; Xu, Y.; Yamamoto, Y. S.; Zhao, B.; Liz-Marzán, L. M. Present and Future of Surface-Enhanced Raman Scattering. ACS Nano 2020, 14 (1), 28–117. https://doi.org/10.1021/acsnano.9b04224.
- Vandenabeele, P.; Edwards, H. G. M.; Moens, L. A Decade of Raman Spectroscopy in Art and Archaeology. Chem. Rev. 2007, 107 (3), 675–686. https://doi.org/10.1021/cr068036i.
- Burgio, L.; Clark, R. J. H. Library of FT-Raman Spectra of Pigments, Minerals, Pigment Media and Varnishes, and Supplement to Existing Library of Raman Spectra of Pigments with Visible Excitation. Spectrochim. Acta. A. Mol. Biomol. Spectrosc. 2001, 57 (7), 1491–1521. https://doi.org/10.1016/S1386-1425(00)00495-9.
- Marucci, G.; Beeby, A.; W. Parker, A.; E. Nicholson, C. Raman Spectroscopic Library of Medieval Pigments Collected with Five Different Wavelengths for Investigation of Illuminated Manuscripts. Anal. Methods 2018, 10 (10), 1219–1236. https://doi.org/10.1039/C8AY00016F.
- Castro, K.; Pérez-Alonso, M.; Rodríguez-Laso, M. D.; Fernández, L. A.; Madariaga, J. M. On-Line FT-Raman and Dispersive Raman Spectra Database of Artists’ Materials (e-VISART Database). Anal. Bioanal. Chem. 2005, 382 (2), 248–258. https://doi.org/10.1007/s00216-005-3072-0.
The slides used in the video can be downloaded from here:


