
MOOC: Instrumental analysis of cultural heritage objects
7.2. Case study 3
Analysis of a crucifix from the Karja church, Estonia
Text Author: Research Fellow Dr Eliise Tammekivi (eliise.tammekivi@ut.ee)
1. Analysed object and aim of the research
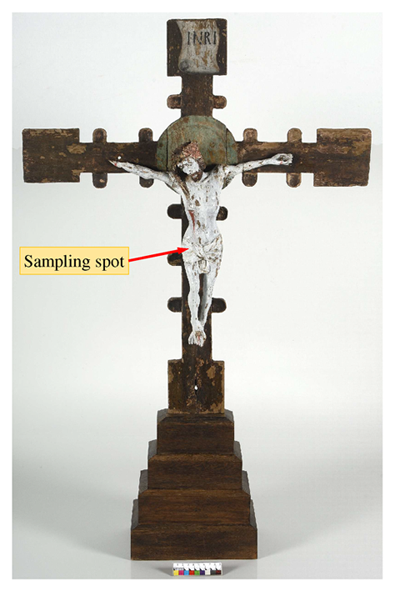
The analysed object was a 15th-century crucifix from the Karja church, Estonia (Fig. 1, the owner of the object is the EELK Karja Katariina church congregation). Based on written information, the artefact had been partially overpainted with white paint in 1924.
The aim of the analysis was to find out what materials had been used in the overpainting of the Christ figurine. For the instrumental analysis, small pieces of the white paint sample were scraped from the perizoma of the Christ figurine.
2. Used analytical techniques
First, ATR-FT-IR analysis of the small paint pieces was performed to obtain information about the pigments, fillers/additives, and binding materials. The advantage of using the ATR-FT-IR method as the first step is the possibility of recollecting the sample after the analysis (in the same chemical form) and using it for other instrumental analyses. The ATR-FT-IR method is highly suitable for the identification of many widely used pigments and fillers. In the case of binding materials, often additional chromatographic and mass spectrometric analysis is needed besides ATR-FT-IR because, with that, it is possible to determine the class of binder (e.g., oil, protein, carbohydrates, etc.) however, not exactly which oil (e.g., linseed oil, poppy oil, etc.) or protein (e.g., tempera, casein, etc.) is in the paint. Also, there are difficulties in discriminating ester-type binders (e.g., oils, waxes, resins, polyesters, etc.) in the paint mixtures. This is because the compounds in different binders may contain the same functional groups, making their identification with IR spectroscopy difficult, if not impossible.
In the case of ester-type binding materials, like oils, GC is a good technique because of the possibility to differentiate between oils, waxes, resins, or even their mixtures [1]. In GC-MS, the most common ways to assign compounds and characterise the used binding material is to analyse the corresponding standard compounds and/or to use a database (e.g., NIST).
ATR-FT-IR analysis
For the ATR-FT-IR analysis, a small white paint sample (mass around 0.1 mg) was used. The sample preparation consisted of removing the white paint from the underlying paint with a scalpel under an optical microscope (Olympus SZX7 microscope). The obtained piece was analysed using an ATR-FT-IR (Thermo Scientific Nicolet 6700 FT-IR spectrometer with Smart Orbit diamond micro-ATR accessory) without any other sample preparation. The small paint piece was placed on the ATR crystal and pressed tightly against it.
GC-MS analysis
Methylation with TMTFTH (aka Meth-Prep II) reagent was used as the derivatisation method. 2 mg of white paint was weighed into a chromatographic vial. Then, 150 µL of toluene and 50 µL of TMTFTH 5% solution in methanol were added to the sample. The sample, together with the reaction mixture, was sonicated for 30 minutes. After sonification, the mixture was kept for 24 h at room temperature to complete the derivatisation. The next day, the mixture was centrifuged for 3 minutes at 3000 rpm to separate the undissolved part of the sample. 100 µL of the obtained clear solution was transferred into a chromatographic vial equipped with a 250 µL conical insert. Then the solution was analysed with an Agilent Technologies 7890A GC instrument coupled with a DB-225ms column and a 5975C MS detector.
3. Results
ATR-FT-IR analysis
The ATR-FT-IR spectrum of white paint (Fig. 2) and the interpretation (Table 1) are presented below.
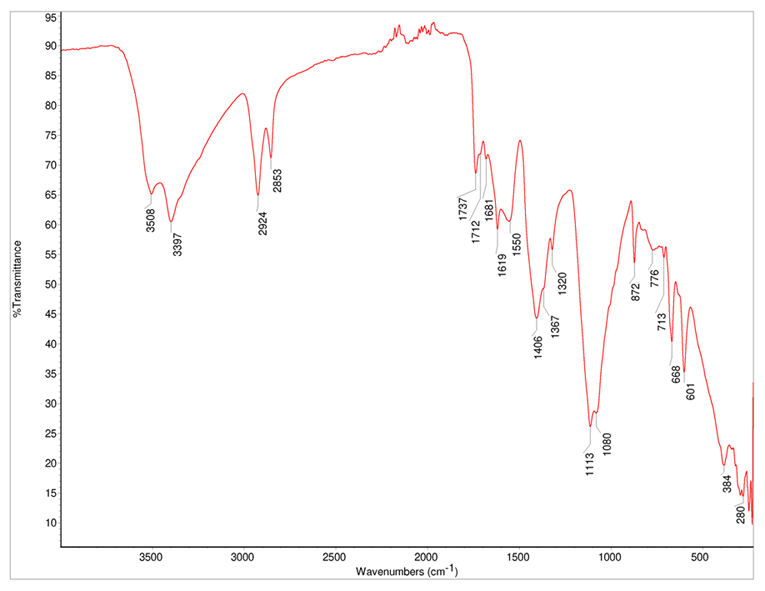
Table 1. Interpretation of the ATR-FT-IR spectrum of the white paint.
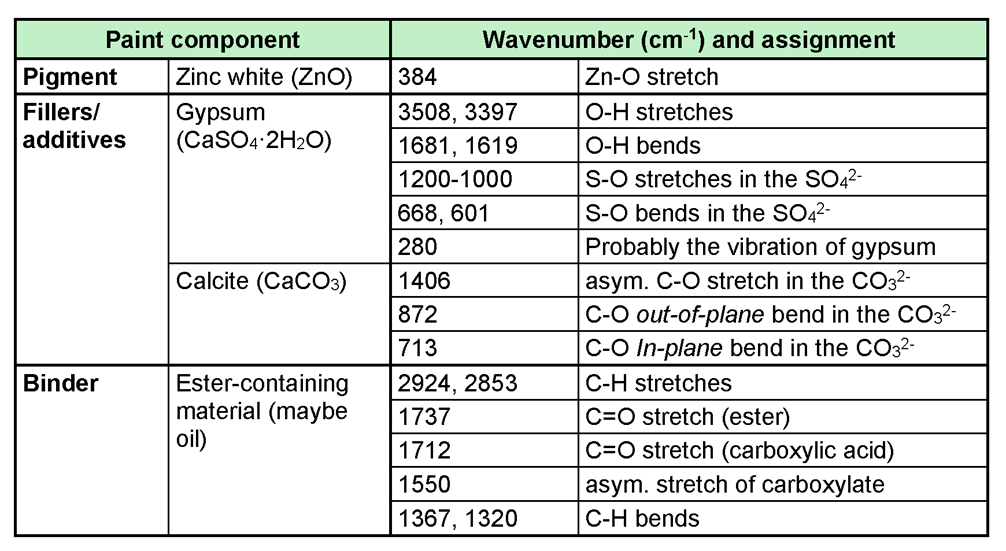
The results show that zinc white (ZnO) was identified as the pigment, gypsum (CaSO4∙2H2O), and chalk (CaCO3) as fillers. Based on the other absorption bands in the ATR-FT-IR spectrum, it can be said that the binder is an ester-type material (possibly an oil).
GC-MS analysis
To get more information about the ester-type binding material, GC-MS analysis was performed. The obtained gas chromatogram of the derivatised white paint sample is presented in Fig. 3. The interpretation of the main peaks with retention times and the corresponding original, underivatised compounds are presented in Table 2.

The peak with a retention time of 9.299 min corresponds to the internal standard (hexadecane). Other identified peaks present the methylated sample compounds. Hexadecane and palmitic, stearic, and oleic acid were assigned by analysing a mixture containing the same standards and additionally confirming using the mass spectra with the NIST database. The other compounds, for which we did not have standard compounds, were assigned by comparing the obtained spectra with the spectra of the NIST database. For every assigned compound, the spectral match was at least 95%.
Table 2. Interpretation of the GC-MS analysis results of the white paint sample. ME – methyl ester, dME – dimethyl ester.
| Peak | tR (min) | Assigned compound |
|---|---|---|
| A | 9.299 | Hexadecane |
| B | 11.596 | Pimelic acid, dME |
| C | 12.689 | Suberic acid, dME |
| D | 13.284 | 9-oxononanoic acid, ME |
| E | 13.715 | Azelaic acid, dME |
| F | 14.688 | Sebacic acid, dME |
| G | 14.888 | Palmitic acid, ME |
| H | 17.482 | Stearic acid, ME |
| I | 17.746 | Oleic acid, ME |
In this case, the type of binding material was identified based on the molecular profile. Dicarboxylic acids (pimelic, suberic, azelaic, and sebacic acid) are the decomposition products of oils. The presence of palmitic, stearic, and oleic acid also suggests that the binding material was an oil. The peak ratios of different fatty acids are used to characterise the oil even further. The azelaic to palmitic acid ratio (A/P) was higher than 1, which indicates that the binding material was a drying oil (like linseed, poppy, or walnut oil). The palmitic to the stearic acid ratio (P/S) for this sample was 1.3, which implies that the used drying oil was likely linseed oil (P/S ratio for linseed oil is commonly 1.6 +/- 0.3). More information and examples about the derivatisation, interpretation, and GC-MS analysis of oils can be found in a PhD thesis of Eliise Tammekivi [2].
4. Conclusion
The applied instrumental techniques enabled the thorough chemical analysis of the white paint that was used to paint over the Christ sculpture in 1924. Based on the ATR-FT-IR analysis, we can say that zinc white had been used as a pigment to give the white colour, gypsum and calcite were used as fillers/additives in the mixture. Although the ATR-FT-IR analysis demonstrated that an ester-type material was used to bind together all other components, GC-MS was needed to determine that the binding material was a drying oil, likely linseed oil.
- Tammekivi, E.; Vahur, S.; Kekišev, O.; Werf, I. D. van der; Toom, L.; Herodes, K.; Leito, I. Comparison of Derivatization Methods for the Quantitative Gas Chromatographic Analysis of Oils. Anal. Methods 2019, 11 (28), 3514–3522.
- Tammekivi, E. Derivatization and Quantitative Gas-Chromatographic Analysis of Oils; PhD Thesis; University of Tartu: Tartu, Estonia, 2021.