
MOOC: Instrumental analysis of cultural heritage objects
4.4. IRMS
In this section, an overview of Isotope Ratio Mass Spectrometry (IRMS) will be given in the context of analysing cultural heritage-related samples (for example archaeological organic residue analysis). The principal theory is explained and two main approaches – Elemental analysis isotope ratio mass spectrometry (EA-IRMS) and Gas chromatography – combustion – isotope ratio mass spectrometry (GC-C-IRMS) – are introduced.
1. General aspects of IRMS
Isotope Ratio Mass Spectrometry (IRMS) is a technique that is used in fields such as archaeology, geology, medicine, biology, food authenticity, and forensic science [1]. IRMS enables to measure ratios of isotope abundances of an element in a sample with very high accuracy. Typically light elements (traditional stable isotope systems) are used for the analysis: H, C, N, O or S, but also non-traditional isotopes (Li, B, Mg, Ca, Fe, Mo, etc.) can be useful in some applications.
Isotopic analysis can be used to investigate human and animal diets in the past, for food authentication, to reconstruct past environmental and climatic conditions, etc.
Isotopes and stable isotopes
Isotopes are atoms whose nuclei contain the same number of protons (atomic number Z) but a different number of neutrons (neutron number N) [2]. While the number of protons defines the element (e.g., H, C, etc.), the sum of the protons and neutrons gives the atomic mass and the number of neutrons defines the isotope of that element. Natural elements are mostly mixtures of isotopes. For example, most of the carbon atoms (≈ 99%) have 6 protons and 6 neutrons, written as 12C to reflect the atomic mass. About 1% of the carbon atoms in the Earth’s carbon pool have, however, 6 protons and 7 neutrons (13C) representing the heavy isotope of this element. Isotopes can be stable or radioactive. The latter undergo radioactive decay at very different rates from a fraction of a second to tens of billions of years.
Stable isotopes do not undergo radioactive decay, are indefinitely stable and can be transformed only in nuclear synthesis reactions. However, stable isotopes may be radiogenic (i.e., produced by radioactive decay). Both heavy and light stable isotopes participate in chemical reactions, including in biological and geochemical processes, but the rate at which stable isotopes react in chemical reactions differs. The lighter isotopes react faster than the heavy isotopes leading to isotopic separation or fractionation between reactant and product in both physical and biological reactions. Isotopic fractionation also occurs in physical processes like the evaporation of water when H2O molecules composed of light isotopes are more easily transferred into vapour phase leaving residual water enriched with isotopically heavy water molecules. Isotope fractionation describes fractionation processes that affect the relative abundance of isotopes. Relative abundances of light and heavy isotopes can be measured by isotope analysis, using an IRMS instrument.
Natural variations in isotope ratios are very small. Therefore, the ratios of these isotopes are always measured relative to an isotopic standard to eliminate bias or systematic error in the measurements. Isotope ratios of samples are measured relative to universal standards and are presented in the delta notation (δ) with unit being parts per thousand (per mil, ‰):

where R is the ratio of heavier (atomic mass M) and lighter isotope for element X. The value Rsample is the abundance ratio of the minor (typically heavier) isotope to the major (typically lighter) isotope, e.g. 15N/14N. Rstandard is measured using standard samples with accurately known abundance ratios. The delta value of a universal standard is zero. For example, carbon isotope ratios are measured against the Pee Dee Belemnite standard (PDB) with δ13C value 0‰. The materials studied for their isotope composition can be enriched or depleted with respect to the heavy isotope. This means that they can have both positive or negative delta values. The δ13C value of 10‰ means that material is enriched with respect to the heavy isotope (13C) and value of -10‰ means that material is depleted with respect to the heavy isotope.
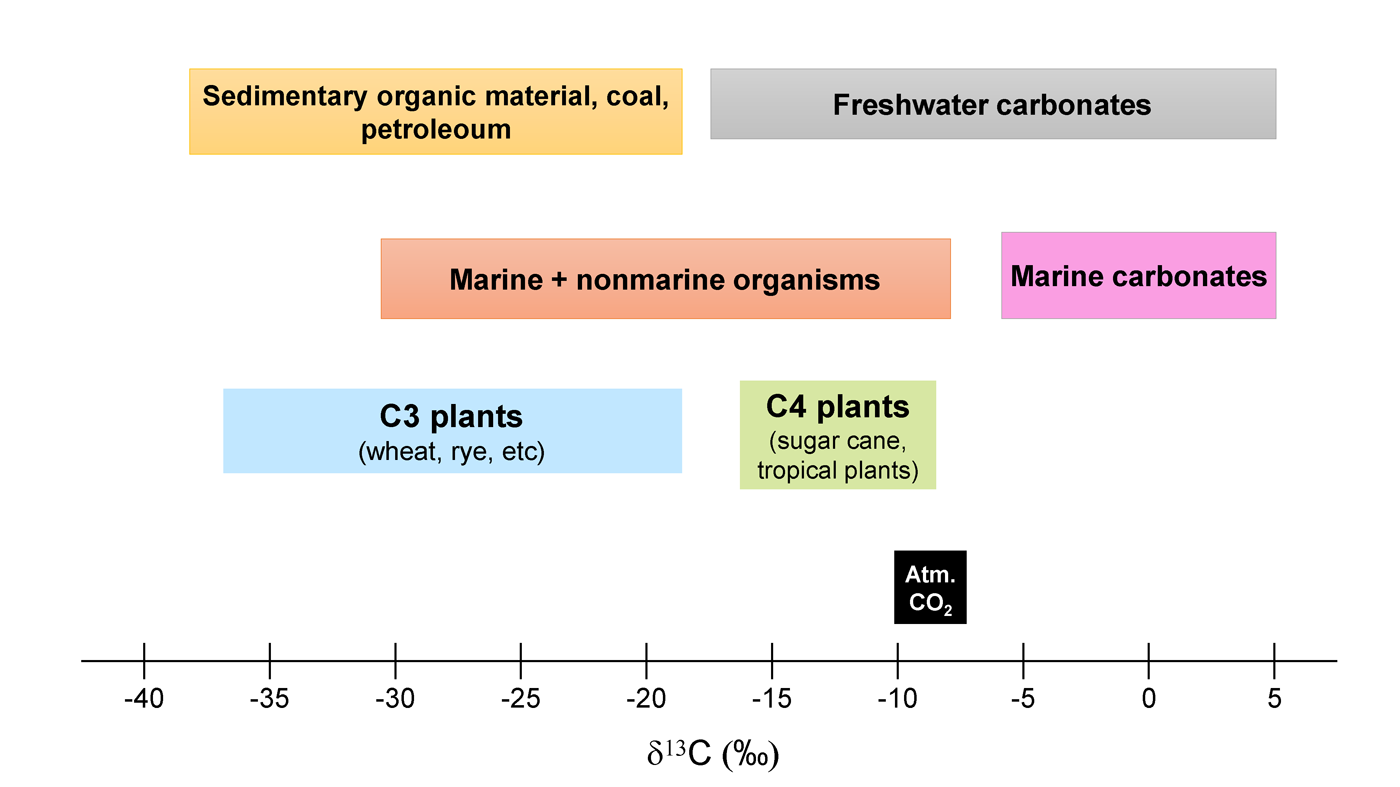
The stable isotope composition of the natural materials is used as indicators of physical or chemical (incl. biological, ageing, etc.) processes and geochemical cycles. They also act as conservative tracers to identify, for example, food sources, nutrient cycling, environmental conditions etc. Fig. 1 shows that different plants, marine organisms, coal, petroleum etc., have isotope δ13C (‰) values that are characteristic for them. Such previously established organism or environment-specific reference materials/isotopic baselines are particularly useful when dealing with the samples of unknown origin and may e.g. help to identify the type of plants or living conditions of different organisms.
IRMS instrumentation
Commonly used mass spectrometers (quadrupoles, ion traps, time-of-flight mass spectrometers) typically do not provide the accuracy or precision required to detect the subtle differences in naturally occurring isotopic abundances. The measurement of natural isotopic abundances requires a specialized instrument such as a multi-collector magnetic sector mass spectrometer, also known as isotope ratio mass spectrometer (IRMS) [1], which separates the different isotopes of an element on the basis of their mass-to-charge ratio (m/z).
A general design of an IRMS instrument is shown in Fig. 2 – sample inlet system, electron ion source, magnetic sector analyzer, Faraday-collector detector array, and computer-controlled data acquisition system.

Inlet systems provide sample gas to the IRMS system. Usually, it contains some peripheral instrument where the sample is converted into a gas mixture (e.g. combustion) and an open split interface (e.g. ConFlo) that directs the gaseous sample from different peripherals and the reference gas to the IRMS system. A mixture of the sample gas and carrier gas is next directed to the ion source, which ionises the gas molecules, accelerates ions and focuses the ion beam in the direction of the magnet. The magnet separates ions from each other on the basis of their mass to charge ratio. The trajectories of lighter ions are more affected than heavier ions and this leads to separation between different masses. There are two different ways to collect ions – (a) collectors are moved into the correct position to gather ions with desired mass, or (b) keep the collectors in a fixed position and change the strength of the magnet field. Ions coming from the magnet hit the specified collectors called Faraday cups. Each incoming ion generates an electrical signal. These electrical signals are amplified, converted into a digital signal, and sent to a computer that records the intensity of the signals generated in the particular cup.
IRMS measures precisely and accurately variations in the abundance of isotopic ratios of light elements such as 13C/12C, 18O/16O, D/1H, 15N/14N, and 34S/32S [1].
IRMS can be realised in several configurations of which two are most widely used in archaeology and geochemistry: Elemental analysis isotope ratio mass spectrometry (EA-IRMS) and Gas chromatography-combustion-isotope ratio mass spectrometry (GC-C-IRMS). EA-IRMS is a bulk measurement technique that measures the average isotope ratios for the entire sample. In contrast, GC-C-IRMS enables the measurement of isotope ratios in specific compounds (molecules) in the sample. Both configurations consist of different peripherals dedicated to sample conversions to a gas used to measure the isotope abundances/ratio. The peripherals are linked to IRMS through an input unit described above that may allow connecting several systems with the same IRMS at once.
2. Analysis with EA-IRMS
As described above, elemental analysis isotope ratio mass spectrometry (EA-IRMS) is a bulk measurement technique which enables measuring average isotope ratios and element weight percentages for the entire sample. EA-IRMS cannot differentiate how each constituent of the sample contributes to the total average value [1]. EA-IRMS is capable of analysing vast variety of sample types – gas, liquid, and solid – as long as the sample burns at 1000 °C and one can pack it into a tin capsule or inject it directly into EA. It is also relatively cheap and fast analysis. The sample amount for this technique can vary between 0.1 mg to hundreds of mg.
In the following video, specialist Holar Sepp, MSc, introduces the principles of EA-IRMS, sample preparation and how to perform analysis with this instrument.
As demonstrated in the video, sample preparation for the analysis is relatively easy. At first sample is homogenized (powdered), weighed and placed in a tin or silver capsule, which is tightly packed. After that, the carefully packed sample is placed into the autosampler for measurement. The autosampler drops the sample capsule into a combustion furnace and the sample is combusted at a high temperature (around 900 – 1100 °C) in oxygen-rich environment. By this, the N, C, S or H are converted into gases NOx, CO2, SO2, or H2O. The gases are next carried by a He gas stream into a reduction chamber where NOx is converted into N2 and excess O2 is removed. The gases are then carried through a chemical trap to remove water that was produced during combustion and then into the gas chromatography column, where separation of the gases is carried out [1]. After gas separation, the EA measures different elements’ weight percentages. A small portion of the generated sample gas is sent to the IRMS system via a mixing interface like ConFlo. As described above, the gas molecules are ionised, accelerated and detected (see Fig. 2) in IRMS. Gas species of different mass are separated in a magnetic field and simultaneously measured by a Faraday cup universal collector array. For example, for N2, masses 28, 29 and 30 and for CO2, masses 44, 45 and 46 are monitored.
EA-IRMS has multiple applications ranging from geology and archaeology to environmental studies and forensics. In archaeology, EA-IRMS is the leading method for ancient dietary reconstructions from bone collagen, hair samples but also from visible food residues (food crusts) collected from the surface of the pottery. [3,4]
EA-IRMS also has some drawbacks. One of the biggest problems is that if different compounds produce the same gas (e.g. CO2), these cannot be identified or separated by the gas source afterwards. Also, if the organic samples are collected from soil, they can be contaminated with carbonate minerals (calcite). These, like organic matter, also produce CO2 upon combustion, which typically has a different isotopic composition. Contamination is also possible during sample collection and/or during pre-treatment – dust, fingerprints, etc. Furthermore, bacteria and fungi inhabiting the samples can interfere with the elemental composition of the original sample. When analysing liquids, a special automatic injection autosampler is recommended. It is possible to seal liquids in a tin capsule, but leakage can be a huge problem: a leaky capsule can contaminate several other capsules inside the autosampler and corrupt the measurements.
3. Analysis with GC-C-IRMS
Gas chromatography-combustion-isotope ratio mass spectrometry (GC-C-IRMS) is a highly specialised instrumental technique used to measure isotope ratios of light stable isotopes of carbon (13C/12C), hydrogen (2H/1H), nitrogen (15N/14N) or oxygen (18O/16O) in individual compounds separated from a complex sample. It is possible to select which specific compound’s (e.g. particular fatty acids, or sterols) isotopic ratios are measured, although, in the case of very old samples, the question of preservation and abundance of different compounds has to be considered as well. The sample amount for this technique depends on the amount of organic compounds in the sample (e.g. ca 1 g of ceramic powder, in which ideally ca 50-100 ng of specific fatty acids should be preserved).
GC-C-IRMS contains four main parts:
- Gas chromatograph (GC) separates organic compounds (molecules) beforehand according to their volatility (determined first of all by molecular mass and functional groups). It is important that the analyte is suitable for GC, i.e. is sufficiently volatile and thermally stable (see lecture Analysis with GC-MS and GC-FID methods). Highly polar compounds may require further chemical modification (derivatisation) and then the relative stable isotope ratio of the derivatisation agent must also be determined. Separated compounds carried by carrier gas (usually He) elute at different retention times, thus making molecules and elements therein separately analysable.
- In C (combustion/ conversion) part, the analytes are combusted at high temperature in oxygen atmosphere (usually 800 to around 1000 °C) into suitable gases for isotopic measurement, e.g. C and N are converted into CO2 and N2, respectively. For determining oxygen and hydrogen isotopic composition, the O and H are converted to CO and H2, respectively, via high-temperature conversion at about 1400 °C in an oxygen-free environment.
- An interface unit like ConFlo is used to introduce sample gas to the IRMS system and for introducing reference gases prior and after the sample (e.g. CO2 for the analysis of 13C/12C). This is needed in order to compensate mass discrimination effects fluctuating in time and between different instruments. By this and using reference materials as part of each run, the results are made compatible between different laboratories/instruments.
- The gases are thereafter directed to the IRMS where the ion source of electron ionisation (EI) separates the ions with specific mass (based on their isotopic composition, i.e. mass) and detected thereafter with Faraday cups. The different isotopic combinations detected in the collectors allow to calculate the isotopic ratios of specific elements in the compounds of our interest.
In the case of cultural heritage-related analysis, the samples are often derivatised before analysis, e.g. methylated for archaeological lipid residue analysis (see Derivatisation and references cited). The latter means addition of certain compounds/elements (e.g. C for methylation), which influence the results of isotopic ratios measured in a specific compound. It is very important to keep this in mind and make necessary corrections to the results to discriminate these isotopic alterations resulting from derivatisation. In addition to samples, several standards are measured within each run in order to calibrate the reference gases, ensure the precision, accuracy and stability of the instrument, as well as to correct the differences in analytical results deriving from sample preparation activities (e.g. methylation correction).
GC-C-IRMS has several fields of use, such as environmental studies, food sciences, authentication, medicine, biology etc. In cultural heritage studies, it is mostly applied to archaeological lipid residue analysis where the isotopic ratios of the major fatty acids found in lipid samples – palmitic (C16:0) and stearic (C18:0) fatty acids – are measured (see Fig. 3). Deriving from different metabolic pathways and environments of organisms the isotopic ratios of C in those two fatty acids allow distinguishing e.g. freshwater and marine sources (fish and mammals), monogastric animal fats like porcine, polygastric animal fats like ruminants, as well as dairy products [5,6]. However, in archaeology, GC-C-IRMS can also be used for compound-specific amino acid isotopic analysis (for both C and N isotopes) in order to distinguish ancient diet as “recorded” in their bone collagen [7,8].

In the following video, Dr Ester Oras introduces the principles of GC-C-IRMS instrument, sample preparation and processing with some examples of applications in archaeological lipid residue analysis.
- Muccio, Z.; Jackson, G. P. Isotope Ratio Mass Spectrometry. Analyst 2009, 134 (2), 213–222. https://doi.org/10.1039/B808232D.
- Hoefs, J. Stable Isotope Geochemistry, 8th ed. 2018.; Springer Textbooks in Earth Sciences, Geography and Environment; Springer International Publishing : Imprint: Springer: Cham, 2018. https://doi.org/10.1007/978-3-319-78527-1.
- Katzenberg, M. A. Stable Isotope Analysis: A Tool for Studying Past Diet, Demography, and Life History. In Biological Anthropology of the Human Skeleton; John Wiley & Sons, Ltd, 2008; pp 411–441. https://doi.org/10.1002/9780470245842.ch13.
- Yoshida, K.; Kunikita, D.; Miyazaki, Y.; Nishida, Y.; Miyao, T.; Matsuzaki, H. Dating and Stable Isotope Analysis of Charred Residues on the Incipient Jomon Pottery (Japan). Radiocarbon 2013, 55 (3), 1322–1333. https://doi.org/10.1017/S0033822200048232.
- Craig, O. E.; Allen, R. B.; Thompson, A.; Stevens, R. E.; Steele, V. J.; Heron, C. Distinguishing Wild Ruminant Lipids by Gas Chromatography/Combustion/Isotope Ratio Mass Spectrometry. Rapid Commun. Mass Spectrom. 2012, 26 (19), 2359–2364. https://doi.org/10.1002/rcm.6349.
- Evershed, R. P.; Dudd, S. N.; Copley, M. S.; Berstan, R.; Stott, A. W.; Mottram, H.; Buckley, S. A.; Crossman, Z. Chemistry of Archaeological Animal Fats. Acc. Chem. Res. 2002, 35 (8), 660–668. https://doi.org/10.1021/ar000200f.
- Webb, E. C.; Honch, N. V.; Dunn, P. J. H.; Eriksson, G.; Lidén, K.; Evershed, R. P. Compound-Specific Amino Acid Isotopic Proxies for Detecting Freshwater Resource Consumption. J. Archaeol. Sci. 2015, 63, 104–114. https://doi.org/10.1016/j.jas.2015.08.001.
- Naito, Y. I.; Bocherens, H.; Chikaraishi, Y.; Drucker, D. G.; Wißing, C.; Yoneda, M.; Ohkouchi, N. An Overview of Methods Used for the Detection of Aquatic Resource Consumption by Humans: Compound-Specific Delta N-15 Analysis of Amino Acids in Archaeological Materials. J. Archaeol. Sci. Rep. 2016, 6, 720–732. https://doi.org/10.1016/j.jasrep.2015.11.025.
The slides used in the video can be downloaded from here: