Carbon and nitrogen stocks and fluxes in Congolese peatlands
Campaign Report by Jaan Pärn, Mikk Espenberg, Kaido Soosaar, Sten Mander, and Ülo Mander
Duration of campaign
6–10 March 2024
Location of sites
Epena Forest Edge (code EFE), 1.347618°N, 17.43732°E, 5 chambers, 3 sessions
Epena Forest Interior (code EFI), 1.3567112°N, 17.4369014,5771°E, 6 chambers, 4 sessions
Epena Grassland A (code EGA), 1.342428°N, 17.442750°E, 6 chambers, 3 sessions
Epena Grassland B (code EGB), 1.347639°N, 17.43819°E, 6 chambers, 3 sessions
Activity report
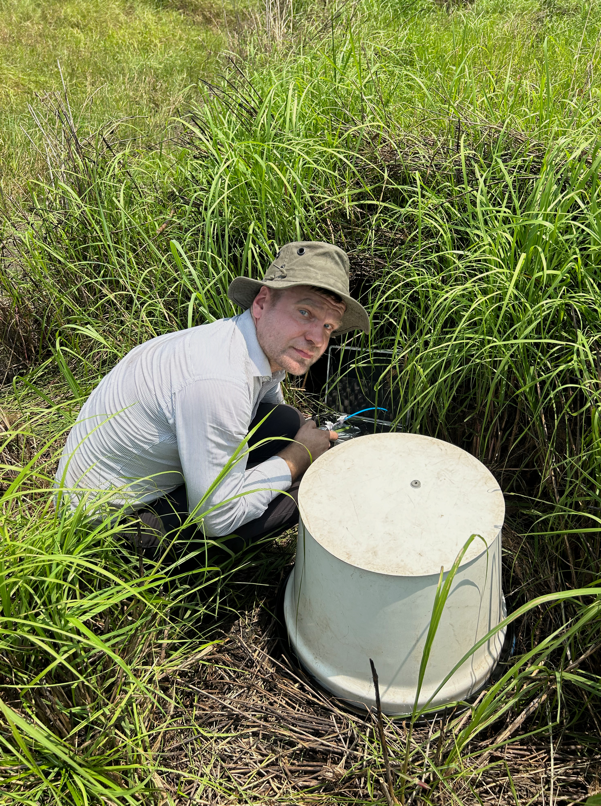
During the expedition, we measured fluxes of three gases: carbon dioxide (CO2), methane (CH4) and nitrous oxide (N2O) in the four sites using opaque soil chambers. Each site received 6 soil chambers randomly placed in a radius of ~50 meters from the centre of the site. The CO2, CH4 and N2O gas concentrations were sampled using the static chamber method with PVC collars of 0.5 m diameter and 0.1 m depth installed in the soil (Figures 1–4). We used white 65 L PVC truncated conical gas sampling chambers. Gas concentration will be measured at 20-minute intervals (0, 20, 40 and 60 minutes). We conducted up to 3 sessions per day – from 8 am to 6 pm – to represent the full day. Figure 1. Gas, soil and plant sampling by Mikk Espenberg, Berveri Mboungu and Sten Mander at the EFI site. |  |
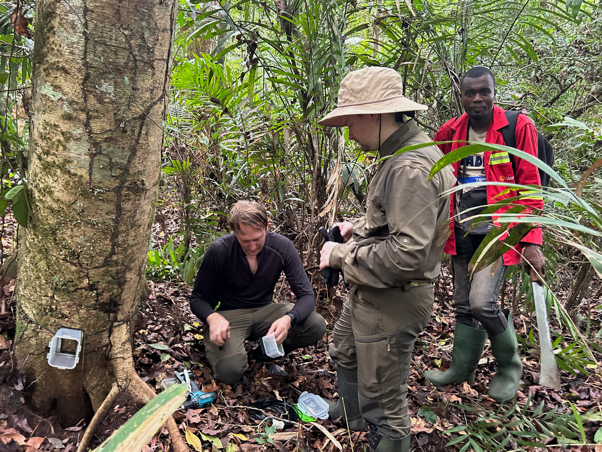
 | To measure tree stem gas fluxes in the two forest sites, we used the static closed tree stem chamber method (Figures 5–7). We equipped 3 trees per site. At each measurement level, two chambers were placed on the opposite side of the tree stem. The installation was done on the first day of fieldwork before measurements. The rectangular chambers were made of transparent plastic containers, including removable airtight lids (Lock & Lock, South Korea). Before the installation, the bottom of the chamber was cut and hot-glued with a neoprene band. The chambers were sealed to the smoothened stem surface with the cord and checked for gas-tightness with an EGM-5 portable CO2 gas analyser (PP Systems). The chambers were installed at each tree stem’s base, as close to the ground as possible (25–35 cm). In addition, to assess the tree stem vertical flux profile, on three stems per plant species, the fluxes were also studied at the heights of 75–85 and 165–175 cm above the ground. During each measurement session, four gas samples (25 ml) were collected through septa from both closed chambers (12.5 ml from either chamber) as the mixed gas samples in a 60 min interval (a 0–60–120–180 min sequence) and stored in pre-evacuated (0.3 bar) gas-tight glass vials (Labco Limited, Lampeter, United Kingdom). After the sample collection, the chamber remained open till the next measurement session. Figure 2. Gas sampling by Jaan Pärn at EGA site |
| All gas samples were transported to a laboratory at the University of Tartu and analysed by gas chromatography (GC-2014; Shimadzu, Kyōto, Japan) instrumented with an electron capture detector for the detection of N2O and a flame ionisation detector for CH4, and Loftfield-type autosamplers. Additionally, each site was equipped with a 1 m deep observation well (a 0.075m perforated PP-HT pipe wrapped in filter textile). Water table height was recorded from the observation wells during the gas sampling. Soil moisture was measured with a Teros 12 sensor (Figure 2). Soil temperature was measured between 0.1 to 0.4 m depth at an interval of 0.1 m. Soil oxygen content was measured with a stand-alone fibre optic oxygen meter (PreSens, Regensburg, Germany) at 0.1m depth. A ~200 g peat sample was collected from each chamber at 0…0.1m and 0.2…0.4m depths after the gas flux measurements (Figures 8–10). The peat samples were transported to Estonia for laboratory chemical and microbiological analyses. Figure 3. Peat sampling by Ülo Mander and Berveri Mboungou at the EFE site |  |
 | All the gas analyses and soil physical-chemical analyses are done; the soil microbiome qPCR analysis is also completed and high-throughput metagenomic the analysis is almost completed. At present, we are analysing data. Greenhouse gas (GHG; CO2, CH4 and N2O) fluxes were very low, most probably due to the severely dry conditions during our study period. Only the forest soil showed remarkable N2O emission. In all sites, CH4 was consumed. N-cycle and CH4-cycle control gene abundancies we accordingly low. As a whole, the campaign successfully identified the peatlands characteristic of Congo (Figures 11 and 12), and established four study sites. The next field campaign is planned for the wet season of the year (November 2024). Figure 4. Preparation and installation of stem chambers by Kaido Soosaar, Mikk Espenberg and Berveri Mboungou on a Guibourtia tree at the EFE site |


