Dynamic writing process graphs
If all participants are on the same scale (0.1s step timeline), you can create one master graph where all the individual writing processes are displayed at the same time. Clicking on the image will take you to the interactive dygraph, where you can zoom in on different parts of the timeline on the range selector. In the example here, you have checkboxes in the upper left corner to choose which series are displayed; these are ordered as in the source Excel table (alphabetically in our case).
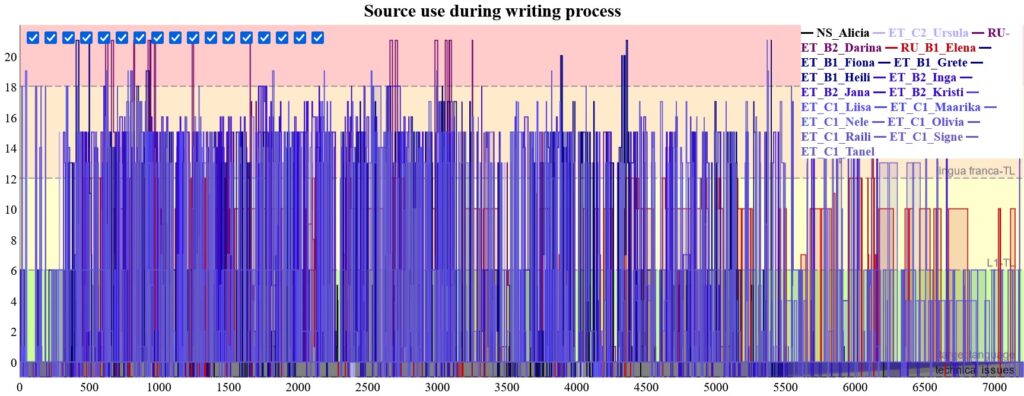
Legend:
- NS = native speaker
- ET = Estonian L1 participant
- RU = Russian L1 participant
- RU-ET = bilingual participant
- B1, B2, C1, C2 = target language proficiency levels
- TL = target language
However, the amount of information displayed in the master version can be overwhelming. So, for an easier overview, below you have dygraphs based on level of proficiency and, further on, individual writing process dygraphs.
Dygraphs based on level of proficiency
Click on images to open process graph in new tab
Participants with B1-level in TL

Participants with B2-level in TL

Participants with C1-level in TL

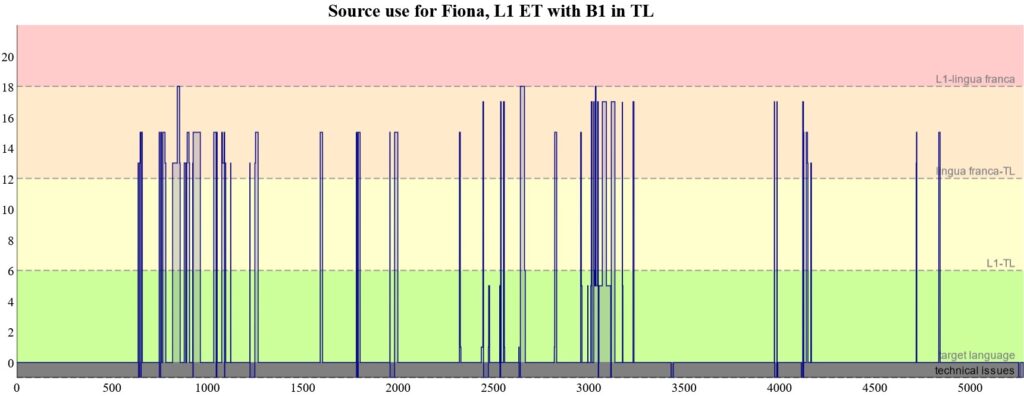
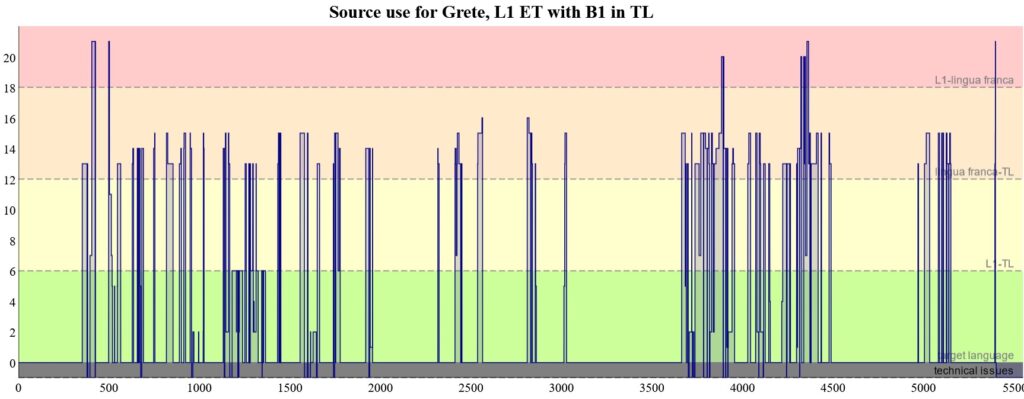
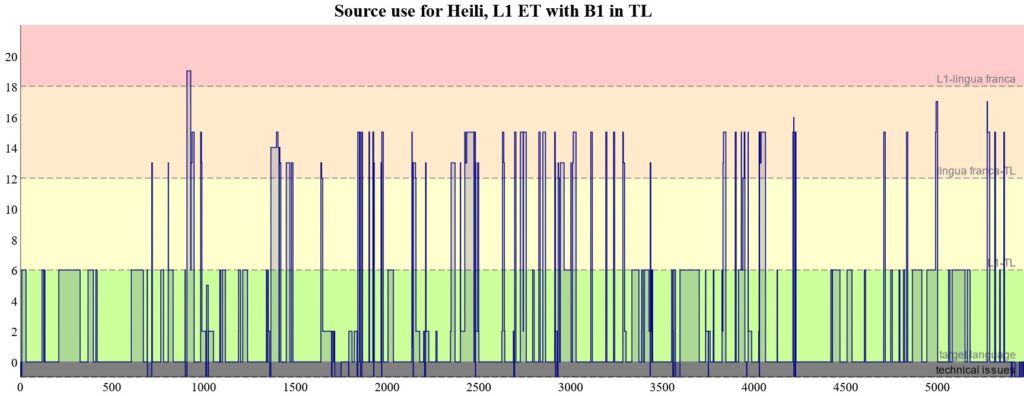
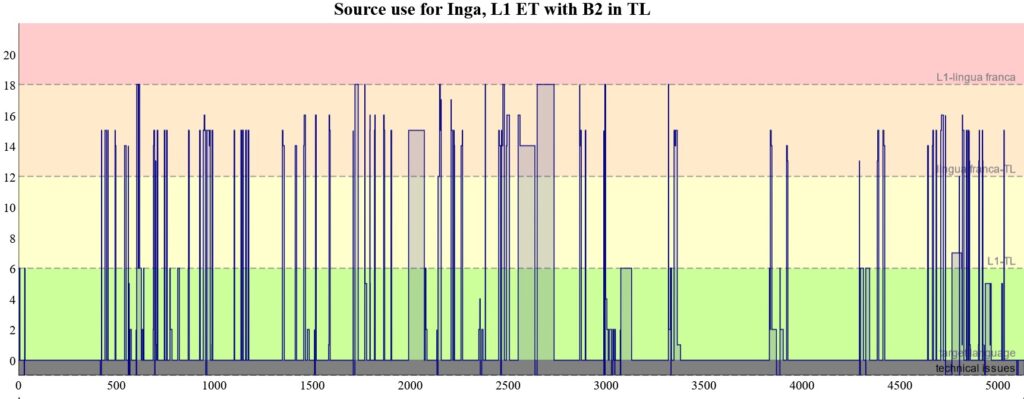
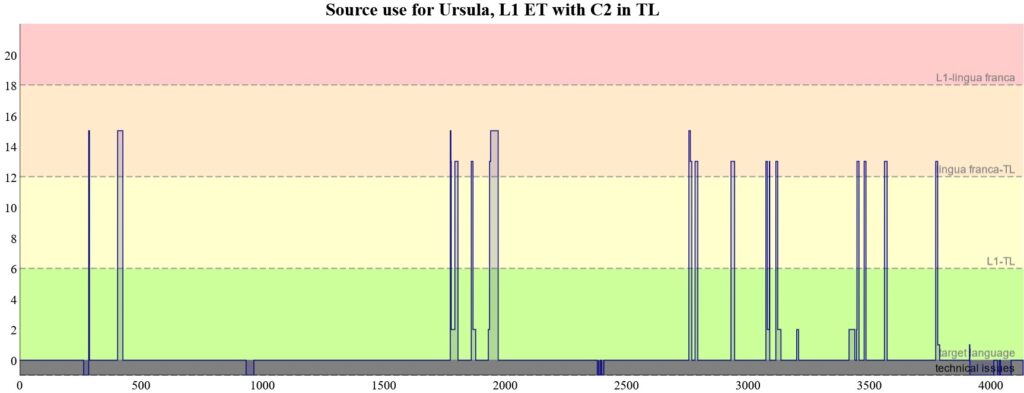
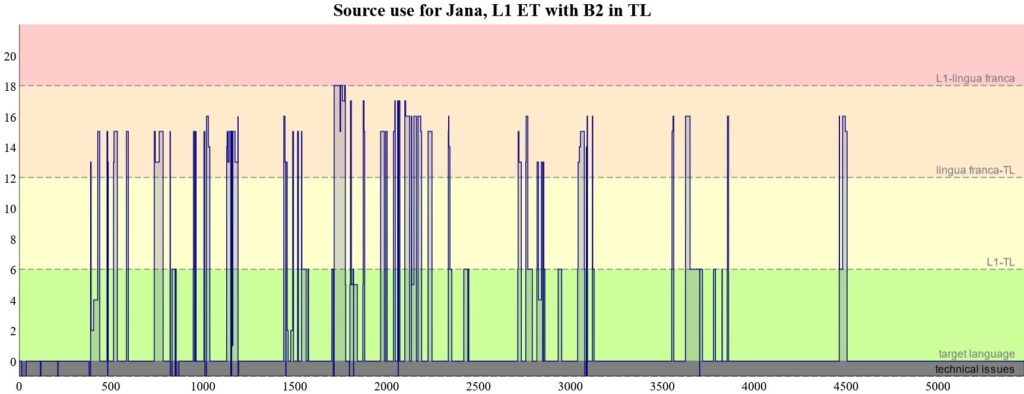
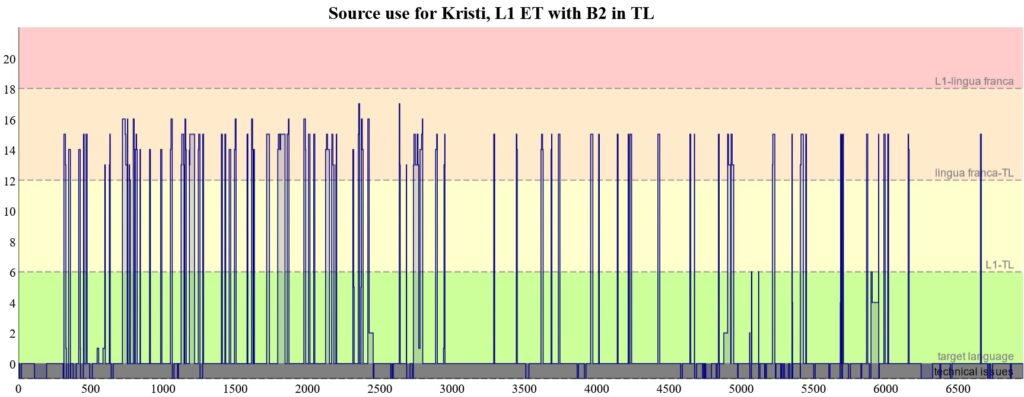
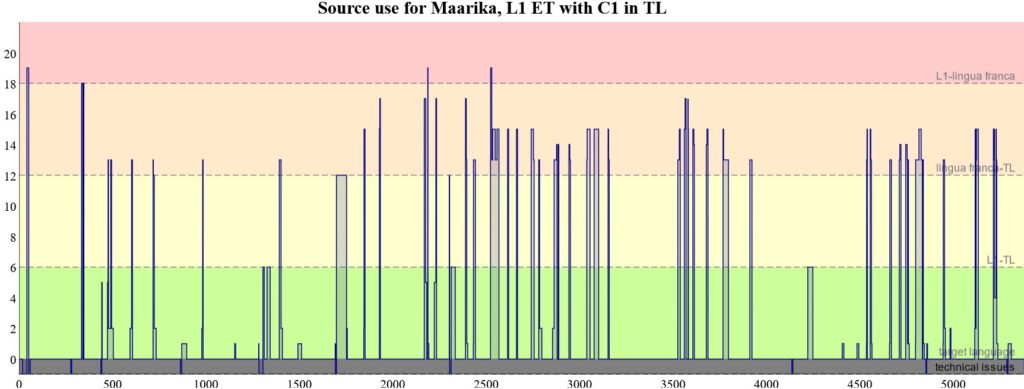
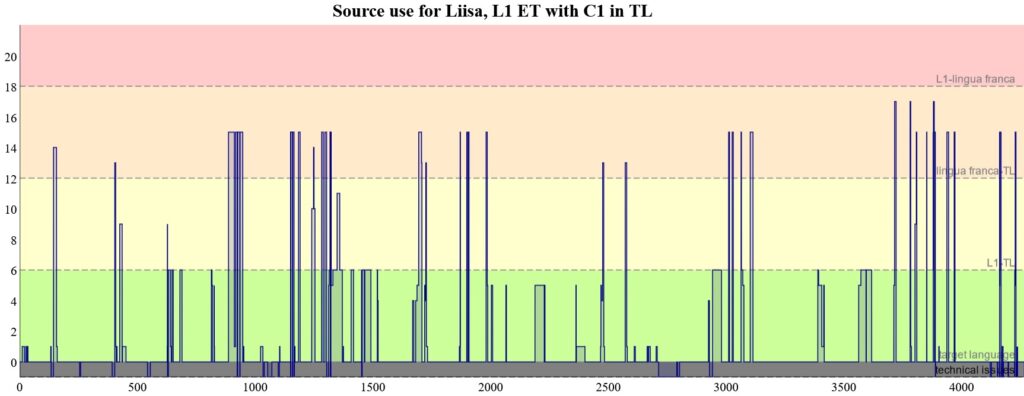
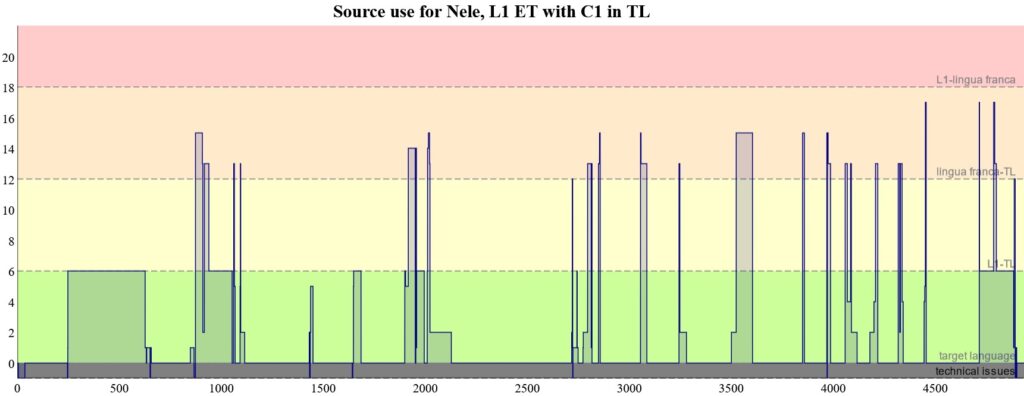
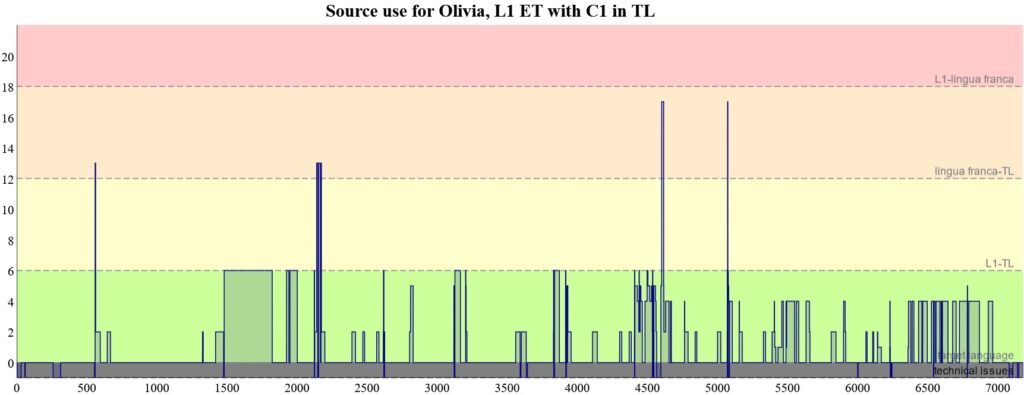
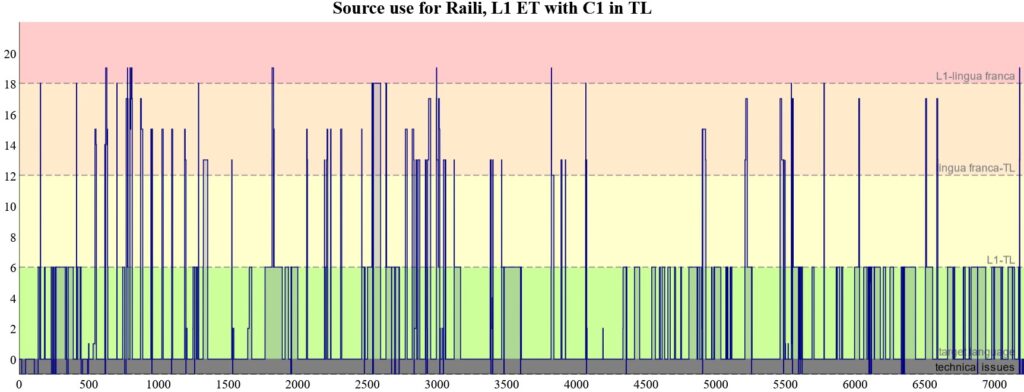
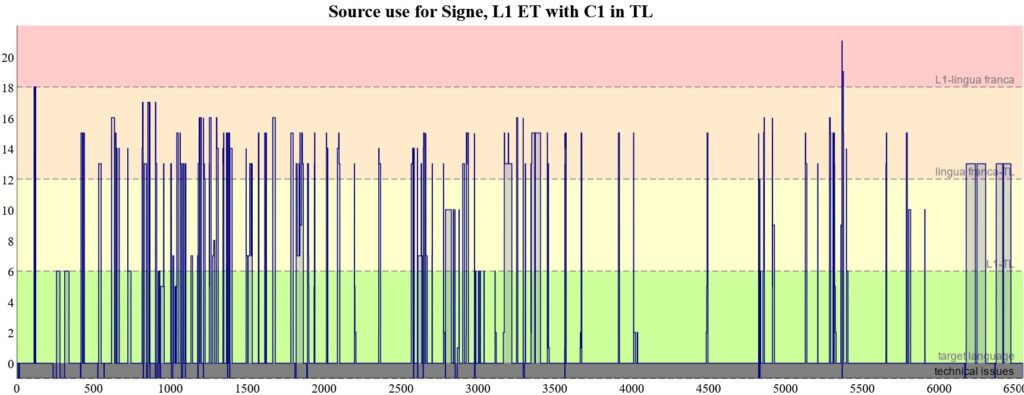
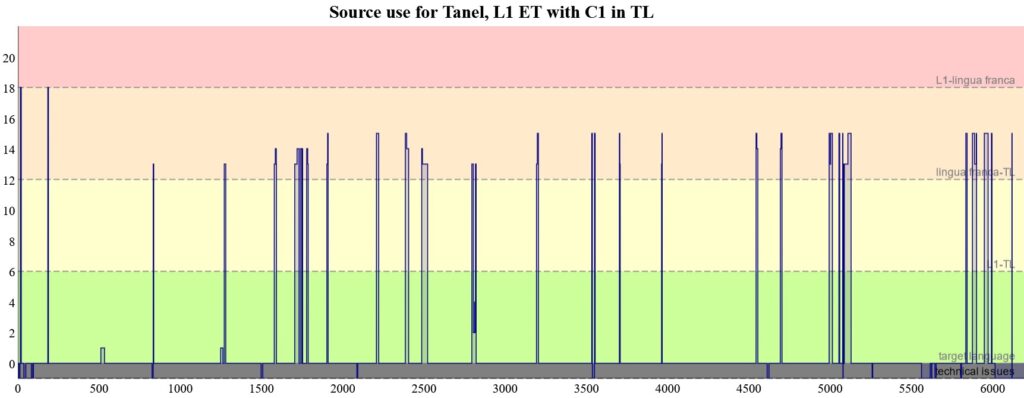
Individual participant dygraphs
Click on images to open process graphs in new tab
NS participant

Russian and bilingual participants


Estonian participants