
All possible uncertainty sources have to be considered and those that are likely to be influential have to be taken into account. The schemes in this section show the uncertainty sources that influence the result of this analysis. Please note, however, that not necessarily all of them need to be individually taken into account in uncertainty estimation. Some may be small so that they can be neglected. Some may be grouped into one uncertainty component.
Uncertainty sources: in general
http://www.uttv.ee/naita?id=17638
https://www.youtube.com/watch?v=EWYNWtRgvmI
Uncertainty sources: one by one
http://www.uttv.ee/naita?id=17639
https://www.youtube.com/watch?v=kEfhKCj44N0
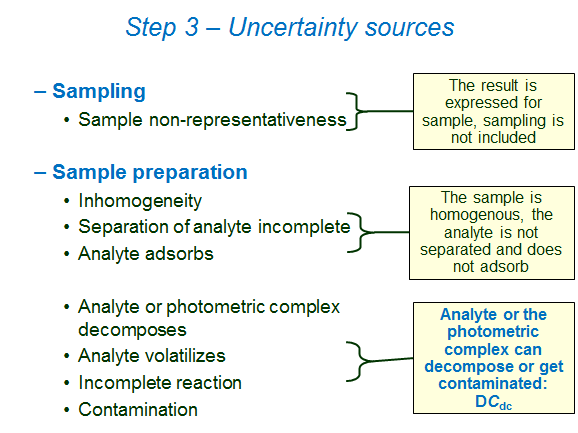
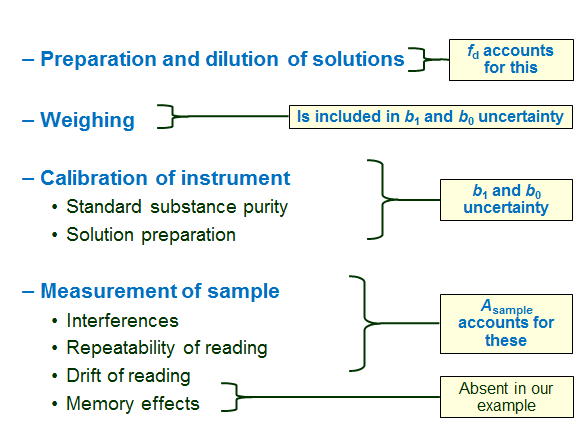
The following schemes list the main uncertainty sources in chemical analysis and comment on the presence or absence of the respective uncertainty sources in our case. [1]Comment on the memory effect as uncertainty source: Memory effect is problematic first of all in the case of trace analysis and secondly, if the analyte is specifically prone to adsorption on glass or plastic surfaces. In this case, although the concentration of ammonium in the sample is quite low, it is still not yet a true trace analysis. Ammonium ion is by no means a strongly adsorbing species. Therefore we can leave the memory effect as uncertainty source out of consideration.
The influence of measurement uncertainty sources, grouped according to input quantities, on the result can be schematically presented in the form of the so-called “fish-bone” diagram:
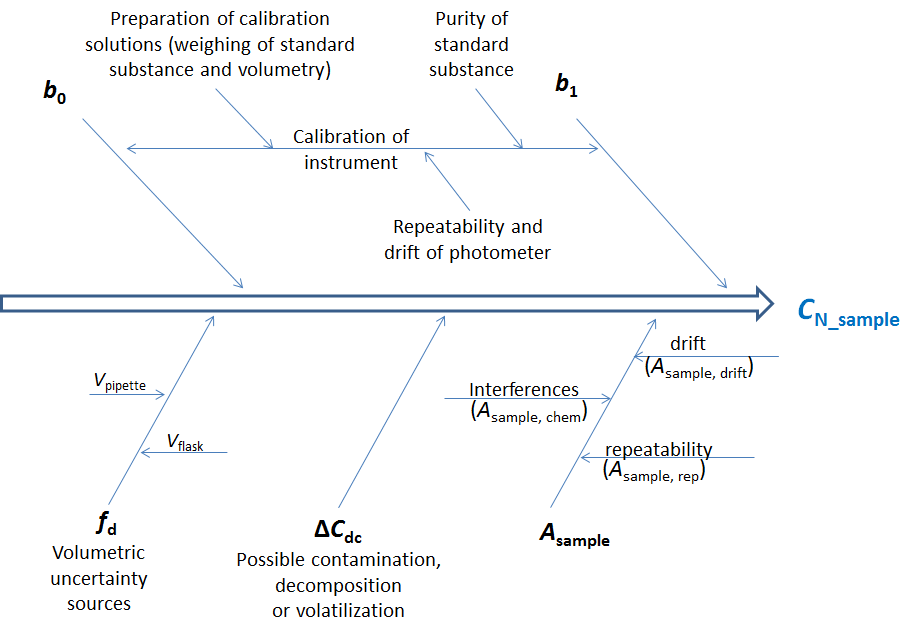
Scheme 9.1. Cause effect diagram: Photometric ammonia determination
About modifying the model
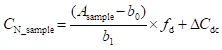
As is explained in the video, this model equation
 (9.2)
(9.2)
, identical to equation 9.1 (in section 9.2) can be regarded as modified model: the term ∆Cdc is brought in to account for some uncertainty sources (possible decomposition, possible contamination). This term is an additive term, i.e. its influence on CN_sample is constant, irrespective of the value of CN_sample. The value of ∆Cdc is 0 mg/l and its uncertainty expresses the absolute (i.e. expressed in mg/l) uncertainty corresponding to the possible effects of decomposition and contamination. Bringing in such additive terms is one typical possibility of modifying the model for taking into account additional uncertainty sources. Additive term is suitable if the additional uncertainty is not very sensitive to analyte concentration (or if analyte concentration does not vary much).
Another typical possibility is to introduce a multiplicative term (or multiplicative factor). In the case of such modification the equation would look as follows:
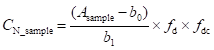 (9.3)
(9.3)
In this case the value of fdc would be 1 and its uncertainty would express the relative (i.e. unitless) uncertainty corresponding to the possible effects of decomposition and contamination. Multiplicative term is suitable if the additional uncertainty is roughly proportional to analyte concentration and if analyte concentration varies significantly. In the case of the data of this example the suitable value of u(fdc) would be u(fdc) = u(∆Cdc) / CN_sample = 0.019.
***
[1] Comment on the memory effect as uncertainty source: Memory effect is problematic first of all in the case of trace analysis and secondly, if the analyte is specifically prone to adsorption on glass or plastic surfaces. In this case, although the concentration of ammonium in the sample is quite low, it is still not yet a true trace analysis. Ammonium ion is by no means a strongly adsorbing species. Therefore we can leave the memory effect as uncertainty source out of consideration.

